Lowest Crowds All Month – Disney World Wait Times for Friday, April 30, 2021

Posted wait times were the lowest they’ve been all month in Walt Disney World, with every park’s average wait time the lowest or second-lowest they’ve been in the past 30 days.  Maybe everyone’s just getting in line early for VelociCoaster over at Universal.  Still, our fabulous Lines community has submitted 176 actual wait times so far today.  And while I was at Animal Kingdom this morning, I can confirm there are still many, many birds on the animal trails.  So many birds.

At Magic Kingdom today we observed 481 out of 500 guests (96%) wearing their masks in accordance with Disney’s guidelines.  Let’s do the rest of the numbers!

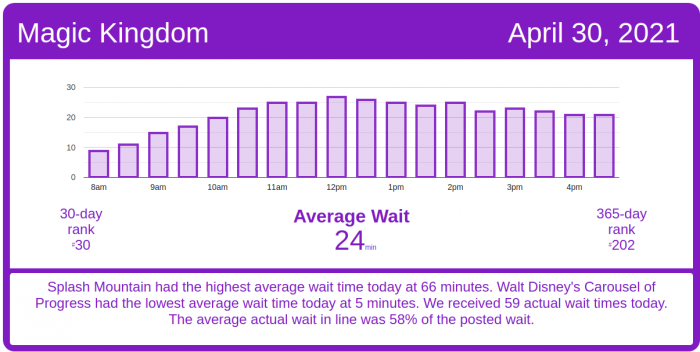
Magic Kingdom Wait Times

The average posted wait time was just 24 minutes at the Magic Kingdom today, and that masks the fact that the actual wait times we got were just 58% of that, or around 14 minutes per attraction.  Those are very low waits.

The Many Adventures of Winnie the Pooh had an average wait time today of 24 minutes. Its 7-day average is 29 minutes, so today ranks #6 for this week. Its 30-day average is 28 minutes, so today ranks #29 for the past month. Its 365-day average is 24 minutes, so today ranks #161 for the past year. We received 5 actual wait times today, and the actual wait averaged 69% of the posted wait time.

Magic Kingdom wait times for Friday, April 30, 2021
Astro Orbiter
Average Posted Wait
23
7-Day Rank
#6
30-Day Rank
#29
365-Day Rank
#233
Big Thunder Mountain Railroad
Average Posted Wait
25
Actual Waits Were
23%
7-Day Rank
#6
30-Day Rank
#27
365-Day Rank
#268
Buzz Lightyear’s Space Ranger Spin
Average Posted Wait
19
7-Day Rank
#6
30-Day Rank
#29
365-Day Rank
#227
Prince Charming Regal Carrousel
Average Posted Wait
24
7-Day Rank
#1
30-Day Rank
#1
365-Day Rank
#1
Dumbo the Flying Elephant
Average Posted Wait
13
7-Day Rank
#5
30-Day Rank
#28
365-Day Rank
#145
“it’s a small world”
Average Posted Wait
22
7-Day Rank
#6
30-Day Rank
#29
365-Day Rank
#260
Jungle Cruise
Average Posted Wait
36
Actual Waits Were
72%
7-Day Rank
#6
30-Day Rank
#29
365-Day Rank
#202
Mad Tea Party
Average Posted Wait
12
7-Day Rank
#6
30-Day Rank
#28
365-Day Rank
#166
Mickey’s PhilharMagic
Average Posted Wait
27
7-Day Rank
#5
30-Day Rank
#26
365-Day Rank
#110
Peter Pan’s Flight
Average Posted Wait
28
Actual Waits Were
99%
7-Day Rank
#6
30-Day Rank
#29
365-Day Rank
#199
Pirates of the Caribbean
Average Posted Wait
32
7-Day Rank
#5
30-Day Rank
#27
365-Day Rank
#233
Space Mountain
Average Posted Wait
40
Actual Waits Were
60%
7-Day Rank
#3
30-Day Rank
#18
365-Day Rank
#140
Splash Mountain
Average Posted Wait
66
7-Day Rank
#4
30-Day Rank
#21
365-Day Rank
#88
The Barnstormer
Average Posted Wait
10
7-Day Rank
#6
30-Day Rank
#28
365-Day Rank
#214
The Haunted Mansion
Average Posted Wait
17
Actual Waits Were
49%
7-Day Rank
#6
30-Day Rank
#30
365-Day Rank
#237
The Magic Carpets of Aladdin
Average Posted Wait
10
7-Day Rank
#6
30-Day Rank
#29
365-Day Rank
#236
The Many Adventures of Winnie the Pooh
Average Posted Wait
24
Actual Waits Were
69%
7-Day Rank
#6
30-Day Rank
#29
365-Day Rank
#161
Tomorrowland Speedway
Average Posted Wait
12
7-Day Rank
#5
30-Day Rank
#27
365-Day Rank
#202
Tomorrowland Transit Authority PeopleMover
Average Posted Wait
26
Actual Waits Were
81%
7-Day Rank
#3
30-Day Rank
#3
365-Day Rank
#4
Walt Disney’s Carousel of Progress
Average Posted Wait
5
7-Day Rank
#1
30-Day Rank
#1
365-Day Rank
#1
Seven Dwarfs Mine Train
Average Posted Wait
47
Actual Waits Were
61%
7-Day Rank
#6
30-Day Rank
#28
365-Day Rank
#211
Under the Sea ~ Journey of the Little Mermaid
Average Posted Wait
17
7-Day Rank
#6
30-Day Rank
#27
365-Day Rank
#193

Animal Kingdom Wait Times

Na’vi River Journey had an average wait time today of 30 minutes. Its 7-day average is 38 minutes, so today ranks #6 for this week. Its 30-day average is 38 minutes, so today ranks #28 for the past month. Its 365-day average is 45 minutes, so today ranks #241 for the past year.

Animal Kingdom wait times for Friday, April 30, 2021
DINOSAUR
Average Posted Wait
33
7-Day Rank
#6
30-Day Rank
#29
365-Day Rank
#150
Expedition Everest – Legend of the Forbidden Mountain
Average Posted Wait
20
Actual Waits Were
64%
7-Day Rank
#3
30-Day Rank
#19
365-Day Rank
#176
Kali River Rapids
Average Posted Wait
32
7-Day Rank
#1
30-Day Rank
#13
365-Day Rank
#37
Kilimanjaro Safaris
Average Posted Wait
15
Actual Waits Were
40%
7-Day Rank
#6
30-Day Rank
#29
365-Day Rank
#207
It’s Tough to Be a Bug!
Average Posted Wait
25
7-Day Rank
#6
30-Day Rank
#27
365-Day Rank
#75
TriceraTop Spin
Average Posted Wait
5
7-Day Rank
#5
30-Day Rank
#21
365-Day Rank
#103
Na’vi River Journey
Average Posted Wait
30
7-Day Rank
#6
30-Day Rank
#28
365-Day Rank
#241
Avatar Flight of Passage
Average Posted Wait
55
Actual Waits Were
81%
7-Day Rank
#6
30-Day Rank
#27
365-Day Rank
#134

Hollywood Studios Wait Times

Mickey & Minnie’s Runaway Railway had an average wait time today of 34 minutes. Its 7-day average is 39 minutes, so today ranks #5 for this week. Its 30-day average is 39 minutes, so today ranks #26 for the past month. Its 365-day average is 55 minutes, so today ranks #284 for the past year. We received 17 actual wait times today, and the actual wait averaged 92% of the posted wait time.

Hollywood Studios wait times for Friday, April 30, 2021

Rise of the Resistance is either having a rough day of operations, or there are simply not enough people in Hollywood Studios who want to ride Disney World’s best ride.  Rise didn’t start calling boarding groups until just past 9:00 a.m. today, about half an hour later than usual. And the calling of boarding groups is running at its slowest pace of the past week.  At its current rate, Rise of the Resistance is unlikely to get past boarding group 130, making it the worst day of the past week.  Maybe it’s lack of demand, and maybe it’s operational issues.
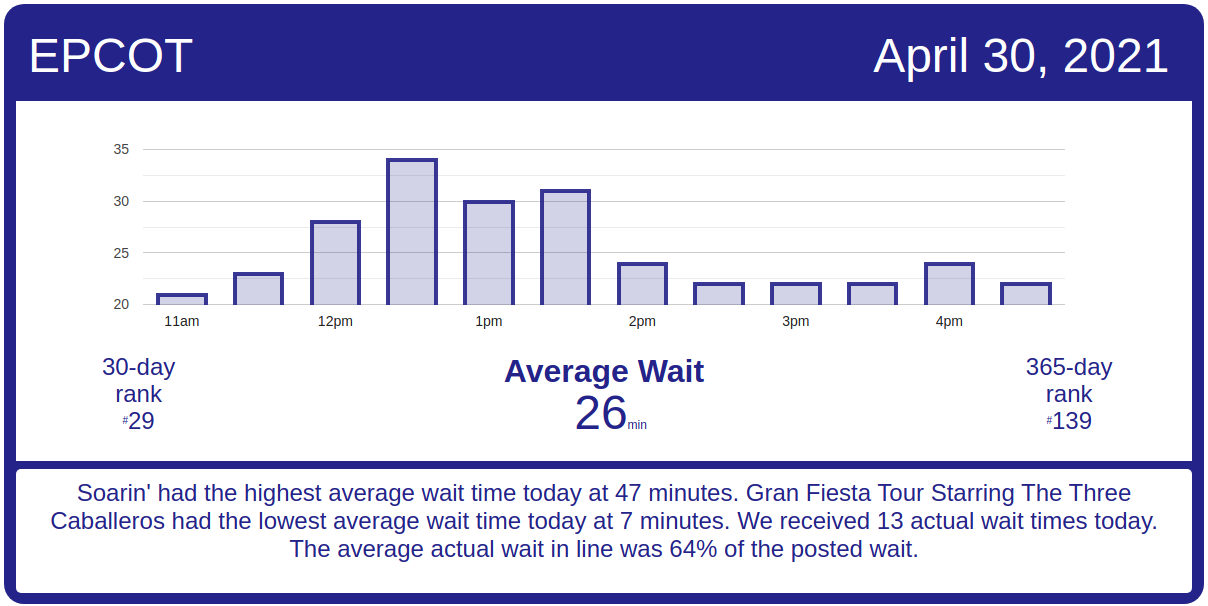
Rise of the Resistance boarding groups for Friday, April 30, 2021
Muppet*Vision 3D
Average Posted Wait
25
Actual Waits Were
77%
7-Day Rank
#6
30-Day Rank
#29
365-Day Rank
#133
Rock ‘n’ Roller Coaster Starring Aerosmith
Average Posted Wait
38
Actual Waits Were
76%
7-Day Rank
#2
30-Day Rank
#17
365-Day Rank
#184
Star Tours: The Adventures Continue
Average Posted Wait
29
Actual Waits Were
68%
7-Day Rank
#3
30-Day Rank
#23
365-Day Rank
#146
The Twilight Zone Tower of Terror
Average Posted Wait
49
7-Day Rank
#5
30-Day Rank
#27
365-Day Rank
#163
Toy Story Mania!
Average Posted Wait
28
Actual Waits Were
71%
7-Day Rank
#4
30-Day Rank
#22
365-Day Rank
#144
Walt Disney Presents
Average Posted Wait
10
7-Day Rank
#1
30-Day Rank
#1
365-Day Rank
#1
Slinky Dog Dash
Average Posted Wait
59
Actual Waits Were
49%
7-Day Rank
#5
30-Day Rank
#24
365-Day Rank
#172
Alien Swirling Saucers
Average Posted Wait
27
Actual Waits Were
64%
7-Day Rank
#4
30-Day Rank
#23
365-Day Rank
#123
Mickey & Minnie’s Runaway Railway
Average Posted Wait
34
Actual Waits Were
92%
7-Day Rank
#5
30-Day Rank
#26
365-Day Rank
#284
Millennium Falcon: Smugglers Run
Average Posted Wait
40
Actual Waits Were
90%
7-Day Rank
#6
30-Day Rank
#30
365-Day Rank
#238
Lightning McQueen’s Racing Academy
Average Posted Wait
19
7-Day Rank
#6
30-Day Rank
#29
365-Day Rank
#144

EPCOT Wait Times

Frozen Ever After had an average wait time today of 33 minutes. Its 7-day average is 42 minutes, so today ranks #6 for this week. Its 30-day average is 47 minutes, so today ranks #29 for the past month. Its 365-day average is 46 minutes, so today ranks #191 for the past year. We received 4 actual wait times today, and the actual wait averaged 68% of the posted wait time.

EPCOT wait times for Friday, April 30, 2021
Gran Fiesta Tour Starring The Three Caballeros
Average Posted Wait
7
7-Day Rank
#4
30-Day Rank
#15
365-Day Rank
#172
Journey Into Imagination With Figment
Average Posted Wait
12
7-Day Rank
#6
30-Day Rank
#27
365-Day Rank
#153
Living with the Land
Average Posted Wait
8
7-Day Rank
#6
30-Day Rank
#29
365-Day Rank
#219
Mission: SPACE Orange
Average Posted Wait
40
7-Day Rank
#6
30-Day Rank
#24
365-Day Rank
#79
Soarin’
Average Posted Wait
47
Actual Waits Were
58%
7-Day Rank
#6
30-Day Rank
#28
365-Day Rank
#99
Spaceship Earth
Average Posted Wait
22
7-Day Rank
#6
30-Day Rank
#29
365-Day Rank
#116
Test Track
Average Posted Wait
47
7-Day Rank
#5
30-Day Rank
#29
365-Day Rank
#186
The Seas with Nemo & Friends
Average Posted Wait
14
7-Day Rank
#5
30-Day Rank
#26
365-Day Rank
#80
Frozen Ever After
Average Posted Wait
33
Actual Waits Were
68%
7-Day Rank
#6
30-Day Rank
#29
365-Day Rank
#191

The post Lowest Crowds All Month – Disney World Wait Times for Friday, April 30, 2021 appeared first on TouringPlans.com Blog.