
What a rainy week so far! With it being a soft travel period to begin with, coupled with poor weather, today’s posted wait times were fairly low across all four theme parks. Magic Kingdom and EPCOT had the least accurate posted wait times when compared to actual wait time data. We received 174 actual wait times today from our Liners, thank you! At Disney’s Hollywood Studios we observed 493 out of 500 guests wearing their masks in accordance with Disney’s guidelines. Let’s pour into the numbers!
Magic Kingdom Wait Times

Astro Orbiter had an average wait time today of 26 minutes. Its 7-day average is 35 minutes, so today ranks #6 for this week. Its 30-day average is 38 minutes, so today ranks #29 for the past month. Its 365-day average is 32 minutes, so today ranks #211 for the past year.
Big Thunder Mountain Railroad had an average wait time today of 33 minutes. Its 7-day average is 31 minutes, so today ranks #1 for this week. Its 30-day average is 39 minutes, so today ranks #22 for the past month. Its 365-day average is 42 minutes, so today ranks #216 for the past year. We received 10 actual wait times today, and the actual wait averaged 30% of the posted wait time.
“it’s a small world” had an average wait time today of 33 minutes. Its 7-day average is 33 minutes, so today ranks #4 for this week. Its 30-day average is 40 minutes, so today ranks #24 for the past month. Its 365-day average is 36 minutes, so today ranks #167 for the past year.
Jungle Cruise had an average wait time today of 42 minutes. Its 7-day average is 42 minutes, so today ranks #3 for this week. Its 30-day average is 48 minutes, so today ranks #24 for the past month. Its 365-day average is 40 minutes, so today ranks #125 for the past year.
Peter Pan’s Flight had an average wait time today of 40 minutes. Its 7-day average is 36 minutes, so today ranks #1 for this week. Its 30-day average is 40 minutes, so today ranks #12 for the past month. Its 365-day average is 33 minutes, so today ranks #84 for the past year.
Pirates of the Caribbean had an average wait time today of 41 minutes. Its 7-day average is 38 minutes, so today ranks #1 for this week. Its 30-day average is 48 minutes, so today ranks #20 for the past month. Its 365-day average is 43 minutes, so today ranks #170 for the past year.
Space Mountain had an average wait time today of 45 minutes. Its 7-day average is 39 minutes, so today ranks #1 for this week. Its 30-day average is 48 minutes, so today ranks #16 for the past month. Its 365-day average is 37 minutes, so today ranks #110 for the past year. We received 7 actual wait times today, and the actual wait averaged 62% of the posted wait time.
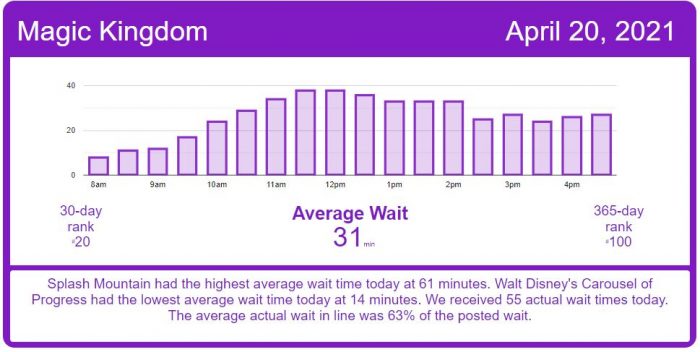
Splash Mountain had an average wait time today of 61 minutes. Its 7-day average is 66 minutes, so today ranks #5 for this week. Its 30-day average is 73 minutes, so today ranks #26 for the past month. Its 365-day average is 53 minutes, so today ranks #103 for the past year.
The Haunted Mansion had an average wait time today of 26 minutes. Its 7-day average is 25 minutes, so today ranks #2 for this week. Its 30-day average is 26 minutes, so today ranks #11 for the past month. Its 365-day average is 28 minutes, so today ranks #152 for the past year. We received 6 actual wait times today, and the actual wait averaged 79% of the posted wait time.
Seven Dwarfs Mine Train had an average wait time today of 50 minutes. Its 7-day average is 51 minutes, so today ranks #2 for this week. Its 30-day average is 59 minutes, so today ranks #24 for the past month. Its 365-day average is 57 minutes, so today ranks #179 for the past year.
Under the Sea ~ Journey of the Little Mermaid had an average wait time today of 25 minutes. Its 7-day average is 23 minutes, so today ranks #1 for this week. Its 30-day average is 23 minutes, so today ranks #8 for the past month. Its 365-day average is 20 minutes, so today ranks #96 for the past year. We received 4 actual wait times today, and the actual wait averaged 51% of the posted wait time.
EPCOT Wait Times

Journey Into Imagination With Figment had an average wait time today of 16 minutes. Its 7-day average is 18 minutes, so today ranks #5 for this week. Its 30-day average is 19 minutes, so today ranks #24 for the past month. Its 365-day average is 14 minutes, so today ranks #101 for the past year.
Living with the Land had an average wait time today of 15 minutes. Its 7-day average is 11 minutes, so today ranks #1 for this week. Its 30-day average is 12 minutes, so today ranks #4 for the past month. Its 365-day average is 11 minutes, so today ranks #35 for the past year.
Mission: SPACE Orange had an average wait time today of 41 minutes. Its 7-day average is 45 minutes, so today ranks #3 for this week. Its 30-day average is 48 minutes, so today ranks #22 for the past month. Its 365-day average is 29 minutes, so today ranks #57 for the past year.
Soarin’ had an average wait time today of 51 minutes. Its 7-day average is 51 minutes, so today ranks #4 for this week. Its 30-day average is 60 minutes, so today ranks #24 for the past month. Its 365-day average is 37 minutes, so today ranks #73 for the past year. We received 7 actual wait times today, and the actual wait averaged 55% of the posted wait time.
Spaceship Earth had an average wait time today of 33 minutes. Its 7-day average is 32 minutes, so today ranks #2 for this week. Its 30-day average is 31 minutes, so today ranks #11 for the past month. Its 365-day average is 19 minutes, so today ranks #23 for the past year. We received 5 actual wait times today, and the actual wait averaged 40% of the posted wait time.
Test Track had an average wait time today of 61 minutes. Its 7-day average is 54 minutes, so today ranks #1 for this week. Its 30-day average is 65 minutes, so today ranks #17 for the past month. Its 365-day average is 55 minutes, so today ranks #110 for the past year.
The Seas with Nemo & Friends had an average wait time today of 18 minutes. Its 7-day average is 16 minutes, so today ranks #2 for this week. Its 30-day average is 18 minutes, so today ranks #13 for the past month. Its 365-day average is 12 minutes, so today ranks #31 for the past year.
Frozen Ever After had an average wait time today of 42 minutes. Its 7-day average is 41 minutes, so today ranks #2 for this week. Its 30-day average is 49 minutes, so today ranks #21 for the past month. Its 365-day average is 46 minutes, so today ranks #142 for the past year. We received 9 actual wait times today, and the actual wait averaged 49% of the posted wait time.
Disney’s Hollywood Studios Wait Times

Muppet*Vision 3D had an average wait time today of 40 minutes. Its 7-day average is 31 minutes, so today ranks #1 for this week. Its 30-day average is 32 minutes, so today ranks #1 for the past month. Its 365-day average is 22 minutes, so today ranks #1 for the past year.
Rock ‘n’ Roller Coaster Starring The Grateful Dead had an average wait time today of 37 minutes. Its 7-day average is 37 minutes, so today ranks #2 for this week. Its 30-day average is 41 minutes, so today ranks #22 for the past month. Its 365-day average is 41 minutes, so today ranks #182 for the past year. We received 9 actual wait times today, and the actual wait averaged 70% of the posted wait time.
The Twilight Zone Tower of Terror had an average wait time today of 43 minutes. Its 7-day average is 55 minutes, so today ranks #6 for this week. Its 30-day average is 63 minutes, so today ranks #29 for the past month. Its 365-day average is 52 minutes, so today ranks #205 for the past year. We received 10 actual wait times today, and the actual wait averaged 92% of the posted wait time.
Toy Story Mania! had an average wait time today of 25 minutes. Its 7-day average is 29 minutes, so today ranks #6 for this week. Its 30-day average is 32 minutes, so today ranks #28 for the past month. Its 365-day average is 27 minutes, so today ranks #189 for the past year. We received 6 actual wait times today, and the actual wait averaged 67% of the posted wait time.
Slinky Dog Dash had an average wait time today of 69 minutes. Its 7-day average is 62 minutes, so today ranks #1 for this week. Its 30-day average is 70 minutes, so today ranks #12 for the past month. Its 365-day average is 59 minutes, so today ranks #74 for the past year. We received 7 actual wait times today, and the actual wait averaged 54% of the posted wait time.
Mickey & Minnie’s Runaway Railway had an average wait time today of 42 minutes. Its 7-day average is 42 minutes, so today ranks #3 for this week. Its 30-day average is 39 minutes, so today ranks #8 for the past month. Its 365-day average is 55 minutes, so today ranks #215 for the past year. We received 14 actual wait times today, and the actual wait averaged 82% of the posted wait time.
Millennium Falcon: Smugglers Run had an average wait time today of 48 minutes. Its 7-day average is 50 minutes, so today ranks #4 for this week. Its 30-day average is 57 minutes, so today ranks #26 for the past month. Its 365-day average is 53 minutes, so today ranks #189 for the past year. We received 10 actual wait times today, and the actual wait averaged 73% of the posted wait time.

Rise of the Resistance is doing better these days. Although it is running at the lower end of pace of the past 7 days, it should reach Boarding Groups in the 140 – 160 range by the end of the day.
Disney’s Animal Kingdom Wait Times

DINOSAUR had an average wait time today of 37 minutes. Its 7-day average is 44 minutes, so today ranks #7 for this week. Its 30-day average is 46 minutes, so today ranks #29 for the past month. Its 365-day average is 33 minutes, so today ranks #132 for the past year. We received 5 actual wait times today, and the actual wait averaged 85% of the posted wait time.
Expedition Everest – Legend of the Forbidden Mountain had an average wait time today of 43 minutes. Its 7-day average is 24 minutes, so today ranks #1 for this week. Its 30-day average is 24 minutes, so today ranks #1 for the past month. Its 365-day average is 25 minutes, so today ranks #23 for the past year.
Kali River Rapids had an average wait time today of 19 minutes. Its 7-day average is 32 minutes, so today ranks #5 for this week. Its 30-day average is 38 minutes, so today ranks #16 for the past month. Its 365-day average is 20 minutes, so today ranks #73 for the past year.
Kilimanjaro Safaris had an average wait time today of 46 minutes. Its 7-day average is 44 minutes, so today ranks #2 for this week. Its 30-day average is 38 minutes, so today ranks #4 for the past month. Its 365-day average is 23 minutes, so today ranks #10 for the past year. We received 6 actual wait times today, and the actual wait averaged 63% of the posted wait time.
Na’vi River Journey had an average wait time today of 35 minutes. Its 7-day average is 40 minutes, so today ranks #6 for this week. Its 30-day average is 41 minutes, so today ranks #27 for the past month. Its 365-day average is 46 minutes, so today ranks #213 for the past year.
Avatar Flight of Passage had an average wait time today of 47 minutes. Its 7-day average is 58 minutes, so today ranks #6 for this week. Its 30-day average is 70 minutes, so today ranks #29 for the past month. Its 365-day average is 49 minutes, so today ranks #150 for the past year. We received 7 actual wait times today, and the actual wait averaged 86% of the posted wait time.
The post Rainy Not So Busy Day – Disney World Wait Times for Tuesday, April 20, 2021 appeared first on TouringPlans.com Blog.