

Although not as busy as the weekends, this week has been pretty busy with Spring Break happening in many parts of the country. EPCOT, Magic Kingdom, and Animal Kingdom all had average posted wait times in the top 10 of the past 30 days. Disney’s Hollywood Studios has implemented some procedures to increase capacity at certain attractions and it shows with its average posted wait times being towards the bottom of the past 30 days. At EPCOT, we observed 487 out of 500 guests (97%) wearing their masks in accordance with Disney’s guidelines.
We received 294 actual wait times in our Lines app from our awesome Liners! Actual wait times were about 65% of what Disney posted as the wait time, which is lower than what we typically see. These actual wait times help us show you the expected wait times to help you make better decisions in the parks, rather than relying on Disney’s inflated wait times. Let’s do the numbers!
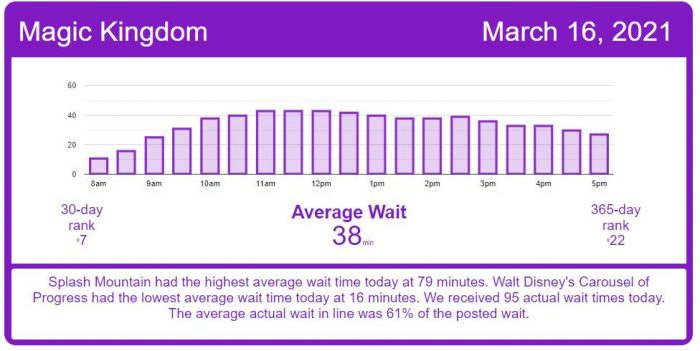
Magic Kingdom Wait Times
Astro Orbiter had an average wait time today of 43 minutes. Its 7-day average is 41 minutes, so today ranks #2 for this week. Its 30-day average is 41 minutes, so today ranks #10 for the past month. Its 365-day average is 31 minutes, so today ranks #28 for the past year.
Big Thunder Mountain Railroad had an average wait time today of 41 minutes. Its 7-day average is 40 minutes, so today ranks #2 for this week. Its 30-day average is 50 minutes, so today ranks #22 for the past month. We received 15 actual wait times today, and the actual wait averaged 20% of the posted wait time, so the average actual wait was 9 minutes.
Buzz Lightyear’s Space Ranger Spin had an average wait time today of 43 minutes. Its 7-day average is 43 minutes, so today ranks #3 for this week. Its 30-day average is 43 minutes, so today ranks #15 for the past month. We received 9 actual wait times today, and the actual wait averaged 59% of the posted wait time, so the average actual wait was 25 minutes.
Jungle Cruise had an average wait time today of 50 minutes. Its 7-day average is 49 minutes, so today ranks #2 for this week. Its 30-day average is 47 minutes, so today ranks #8 for the past month. Its 365-day average is 39 minutes, so today ranks #25 for the past year. We received 8 actual wait times today, and the actual wait averaged 61% of the posted wait time.
Pirates of the Caribbean had an average wait time today of 58 minutes. Its 7-day average is 56 minutes, so today ranks #2 for this week. Its 30-day average is 58 minutes, so today ranks #16 for the past month. We received 9 actual wait times today, and the actual wait averaged 98% of the posted wait time.
Space Mountain had an average wait time today of 54 minutes. Its 7-day average is 53 minutes, so today ranks #3 for this week. Its 30-day average is 49 minutes, so today ranks #11 for the past month. Its 365-day average is 36 minutes, so today ranks #45 for the past year. We received 8 actual wait times today, and the actual wait averaged 65% of the posted wait time.
Splash Mountain had an average wait time today of 79 minutes. Its 7-day average is 79 minutes, so today ranks #4 for this week. Its 30-day average is 70 minutes, so today ranks #8 for the past month. We received 11 actual wait times today, and the actual wait averaged 67% of the posted wait time, so the average actual wait was 53 minutes.
Tomorrowland Speedway had an average wait time today of 18 minutes. Its 7-day average is 19 minutes, so today ranks #4 for this week. Its 30-day average is 20 minutes, so today ranks #18 for the past month. Its 365-day average is 16 minutes, so today ranks #77 for the past year.
Seven Dwarfs Mine Train had an average wait time today of 65 minutes. Its 7-day average is 63 minutes, so today ranks #2 for this week. Its 30-day average is 69 minutes, so today ranks #15 for the past month. Its 365-day average is 56 minutes, so today ranks #81 for the past year.
Under the Sea ~ Journey of the Little Mermaid had an average wait time today of 29 minutes. Its 7-day average is 25 minutes, so today ranks #1 for this week. Its 30-day average is 26 minutes, so today ranks #11 for the past month. Its 365-day average is 20 minutes, so today ranks #47 for the past year.
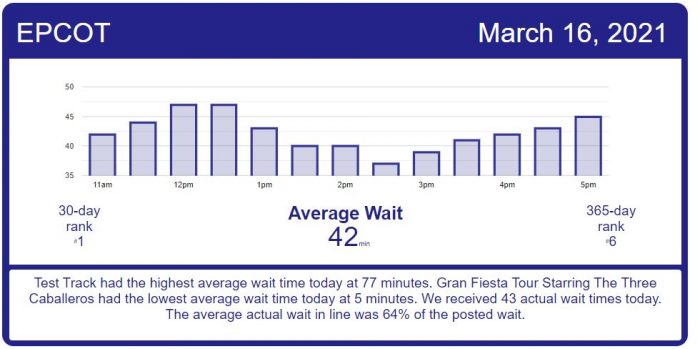
EPCOT Wait Times
This afternoon around lunch time, it was an estimated hour wait to get into the Mexico Pavilion. This has to do with the limited capacity in the pavilion due to the narrow ramps, the marketplace, the dining, and the attraction. Being Spring Break the popularity of La Cava del Tequila has increased which contributed to the long wait to get inside the pavilion, but La Cava created an entrance into the building through a backstage entrance.


Gran Fiesta Tour Starring The Three Caballeros had an average wait time today of 5 minutes. Its 7-day average is 9 minutes, so today ranks #6 for this week. Its 30-day average is 9 minutes, so today ranks #29 for the past month. Its 365-day average is 9 minutes, so today ranks #234 for the past year.
Journey Into Imagination With Figment had an average wait time today of 23 minutes. Its 7-day average is 18 minutes, so today ranks #1 for this week. Its 30-day average is 16 minutes, so today ranks #5 for the past month. Its 365-day average is 13 minutes, so today ranks #33 for the past year. We received 4 actual wait times today, and the actual wait averaged 42% of the posted wait time.
Living with the Land had an average wait time today of 23 minutes. Its 7-day average is 10 minutes, so today ranks #1 for this week. Its 30-day average is 9 minutes, so today ranks #1 for the past month. We received 6 actual wait times today, and the actual wait averaged 26% of the posted wait time, so the average actual wait was 6 minutes.
Soarin’ had an average wait time today of 68 minutes. Its 7-day average is 57 minutes, so today ranks #1 for this week. Its 30-day average is 45 minutes, so today ranks #1 for the past month. We received 4 actual wait times today, and the actual wait averaged 67% of the posted wait time, so the average actual wait was 46 minutes.
Test Track had an average wait time today of 77 minutes. Its 7-day average is 67 minutes, so today ranks #1 for this week. Its 30-day average is 57 minutes, so today ranks #4 for the past month. We received 11 actual wait times today, and the actual wait averaged 78% of the posted wait time, so the average actual wait was 61 minutes.
The Seas with Nemo & Friends had an average wait time today of 23 minutes. Its 7-day average is 16 minutes, so today ranks #1 for this week. Its 30-day average is 12 minutes, so today ranks #1 for the past month. We received 6 actual wait times today, and the actual wait averaged 29% of the posted wait time.
Frozen Ever After had an average wait time today of 66 minutes. Its 7-day average is 45 minutes, so today ranks #1 for this week. Its 30-day average is 37 minutes, so today ranks #1 for the past month. Its 365-day average is 45 minutes, so today ranks #48 for the past year.
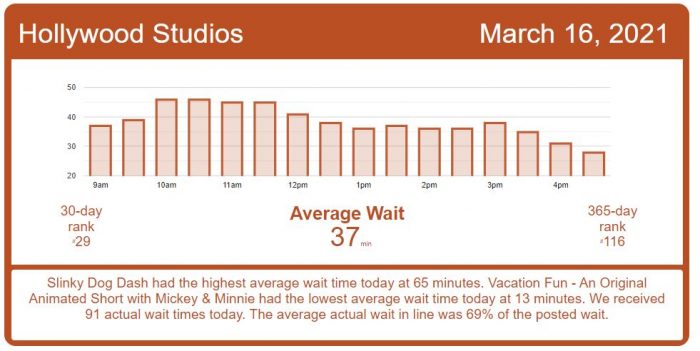
Disney’s Hollywood Studios Wait Times
Rock ‘n’ Roller Coaster Starring Billy Joel had an average wait time today of 42 minutes. Its 7-day average is 48 minutes, so today ranks #6 for this week. Its 30-day average is 45 minutes, so today ranks #18 for the past month. We received 10 actual wait times today, and the actual wait averaged 57% of the posted wait time, so the average actual wait was 24 minutes.
The Twilight Zone Tower of Terror had an average wait time today of 56 minutes. Its 7-day average is 66 minutes, so today ranks #5 for this week. Its 30-day average is 67 minutes, so today ranks #27 for the past month. We received 7 actual wait times today, and the actual wait averaged 85% of the posted wait time, so the average actual wait was 48 minutes.
Toy Story Mania! had an average wait time today of 34 minutes. Its 7-day average is 36 minutes, so today ranks #2 for this week. Its 30-day average is 36 minutes, so today ranks #15 for the past month. We received 16 actual wait times today, and the actual wait averaged 76% of the posted wait time, so the average actual wait was 26 minutes.
Slinky Dog Dash had an average wait time today of 65 minutes. Its 7-day average is 71 minutes, so today ranks #4 for this week. Its 30-day average is 68 minutes, so today ranks #16 for the past month. We received 17 actual wait times today, and the actual wait averaged 58% of the posted wait time, so the average actual wait was 38 minutes.
Mickey & Minnie’s Runaway Railway had an average wait time today of 41 minutes. Its 7-day average is 44 minutes, so today ranks #5 for this week. Its 30-day average is 49 minutes, so today ranks #28 for the past month. We received 17 actual wait times today, and the actual wait averaged 78% of the posted wait time.
Millennium Falcon: Smugglers Run had an average wait time today of 59 minutes. Its 7-day average is 62 minutes, so today ranks #5 for this week. Its 30-day average is 63 minutes, so today ranks #22 for the past month. Its 365-day average is 52 minutes, so today ranks #91 for the past year. We received 8 actual wait times today, and the actual wait averaged 77% of the posted wait time.
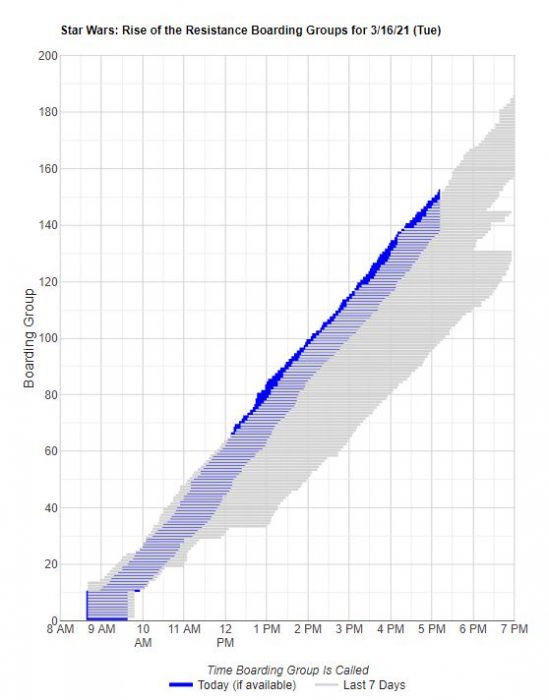
Rise of the Resistance has had no major issues today and is ahead of pace of the past 7 days. It could reach into Boarding Groups in the 180 range by day’s end.
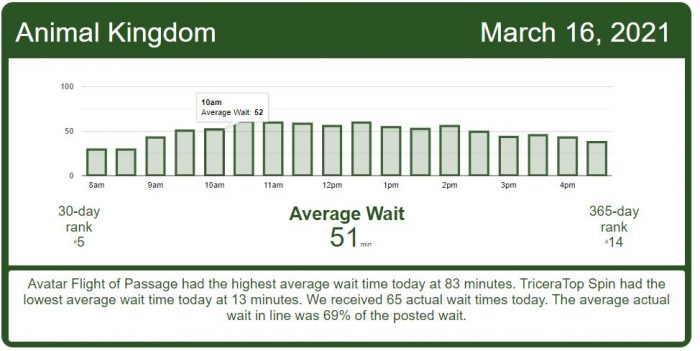
Disney’s Animal Kingdom Wait Times
DINOSAUR had an average wait time today of 64 minutes. Its 7-day average is 55 minutes, so today ranks #1 for this week. Its 30-day average is 49 minutes, so today ranks #2 for the past month. Its 365-day average is 30 minutes, so today ranks #9 for the past year. We received 7 actual wait times today, and the actual wait averaged 94% of the posted wait time.
Expedition Everest – Legend of the Forbidden Mountain had an average wait time today of 39 minutes. Its 7-day average is 27 minutes, so today ranks #1 for this week. Its 30-day average is 23 minutes, so today ranks #3 for the past month. We received 16 actual wait times today, and the actual wait averaged 51% of the posted wait time, so the average actual wait was 20 minutes.
Kilimanjaro Safaris had an average wait time today of 45 minutes. Its 7-day average is 33 minutes, so today ranks #1 for this week. Its 30-day average is 31 minutes, so today ranks #3 for the past month. We received 18 actual wait times today, and the actual wait averaged 50% of the posted wait time, so the average actual wait was about 23 minutes.
Na’vi River Journey had an average wait time today of 82 minutes. Its 7-day average is 80 minutes, so today ranks #3 for this week. Its 30-day average is 75 minutes, so today ranks #9 for the past month. Its 365-day average is 46 minutes, so today ranks #15 for the past year. We received 6 actual wait times today, and the actual wait averaged 81% of the posted wait time.
Avatar Flight of Passage had an average wait time today of 83 minutes. Its 7-day average is 71 minutes, so today ranks #1 for this week. Its 30-day average is 60 minutes, so today ranks #3 for the past month. We received 13 actual wait times today, and the actual wait averaged 78% of the posted wait time, so the average actual wait was 65 minutes.

The post Spring Break Continues – Disney World Wait Times for Tuesday, March 16, 2021 appeared first on TouringPlans.com Blog.