Solid Midweek Crowds – Disney World Wait Times for Wednesday, March 17, 2021

All four Disney parks saw robust crowds today, with average posted wait times at the Magic Kingdom, Animal Kingdom, and EPCOT all in the top 10 days of the past month.  Hollywood Studios’ crowds were smaller, but that may be due to increased ride capacity (or everyone was in line for the newly-released Galaxy’s Edge sporks).

We counted 484 of 500 guests (97%) at Hollywood Studios wearing masks according to Disney’s guidelines.  And we’ve got 246 actual wait times so far today from our fabulous Lines community. Let’s do the rest of the numbers!

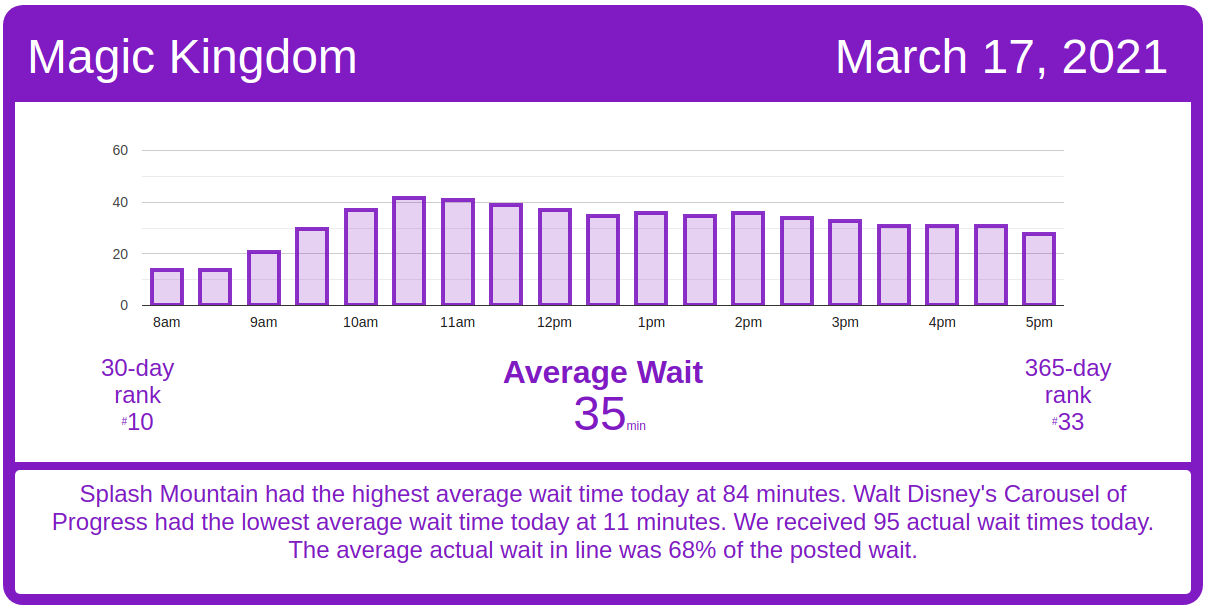
Magic Kingdom Wait Times

Pirates of the Caribbean had an average wait time today of 55 minutes. Its 7-day average is 56 minutes, so today ranks #3 for this week. Its 30-day average is 57 minutes, so today ranks #20 for the past month. Its 365-day average is 43 minutes, so today ranks #49 for the past year. We received 11 actual wait times today, and the actual wait averaged 90% of the posted wait time.

Magic Kingdom wait times for Wednesday, March 17, 2021
Astro Orbiter
Average Posted Wait
39
7-Day Rank
#3
30-Day Rank
#20
365-Day Rank
#58
Big Thunder Mountain Railroad
Average Posted Wait
40
Actual Waits Were
34%
7-Day Rank
#3
30-Day Rank
#23
365-Day Rank
#145
Buzz Lightyear’s Space Ranger Spin
Average Posted Wait
38
Actual Waits Were
61%
7-Day Rank
#6
30-Day Rank
#25
365-Day Rank
#77
Prince Charming Regal Carrousel
Average Posted Wait
37
Actual Waits Were
71%
7-Day Rank
#1
30-Day Rank
#1
365-Day Rank
#1
Country Bear Jamboree
Average Posted Wait
31
7-Day Rank
#1
30-Day Rank
#1
365-Day Rank
#1
Dumbo the Flying Elephant
Average Posted Wait
18
7-Day Rank
#4
30-Day Rank
#22
365-Day Rank
#61
“it’s a small world”
Average Posted Wait
45
Actual Waits Were
84%
7-Day Rank
#4
30-Day Rank
#19
365-Day Rank
#45
Jungle Cruise
Average Posted Wait
50
Actual Waits Were
81%
7-Day Rank
#3
30-Day Rank
#9
365-Day Rank
#28
Mad Tea Party
Average Posted Wait
18
7-Day Rank
#5
30-Day Rank
#17
365-Day Rank
#45
Mickey’s PhilharMagic
Average Posted Wait
32
7-Day Rank
#1
30-Day Rank
#3
365-Day Rank
#21
Peter Pan’s Flight
Average Posted Wait
43
Actual Waits Were
100%
7-Day Rank
#4
30-Day Rank
#15
365-Day Rank
#40
Pirates of the Caribbean
Average Posted Wait
55
Actual Waits Were
90%
7-Day Rank
#3
30-Day Rank
#20
365-Day Rank
#49
Tom Sawyer Island
Average Posted Wait
29
7-Day Rank
#1
30-Day Rank
#1
365-Day Rank
#1
Space Mountain
Average Posted Wait
55
Actual Waits Were
111%
7-Day Rank
#3
30-Day Rank
#11
365-Day Rank
#45
Splash Mountain
Average Posted Wait
84
7-Day Rank
#1
30-Day Rank
#2
365-Day Rank
#10
The Barnstormer
Average Posted Wait
14
Actual Waits Were
70%
7-Day Rank
#6
30-Day Rank
#29
365-Day Rank
#149
The Haunted Mansion
Average Posted Wait
27
Actual Waits Were
55%
7-Day Rank
#5
30-Day Rank
#20
365-Day Rank
#120
The Magic Carpets of Aladdin
Average Posted Wait
16
7-Day Rank
#5
30-Day Rank
#25
365-Day Rank
#67
The Many Adventures of Winnie the Pooh
Average Posted Wait
26
7-Day Rank
#5
30-Day Rank
#26
365-Day Rank
#92
Tomorrowland Speedway
Average Posted Wait
18
7-Day Rank
#4
30-Day Rank
#18
365-Day Rank
#79
Walt Disney’s Carousel of Progress
Average Posted Wait
11
7-Day Rank
#1
30-Day Rank
#1
365-Day Rank
#1
Seven Dwarfs Mine Train
Average Posted Wait
63
Actual Waits Were
54%
7-Day Rank
#3
30-Day Rank
#18
365-Day Rank
#87
Under the Sea ~ Journey of the Little Mermaid
Average Posted Wait
18
7-Day Rank
#6
30-Day Rank
#28
365-Day Rank
#145

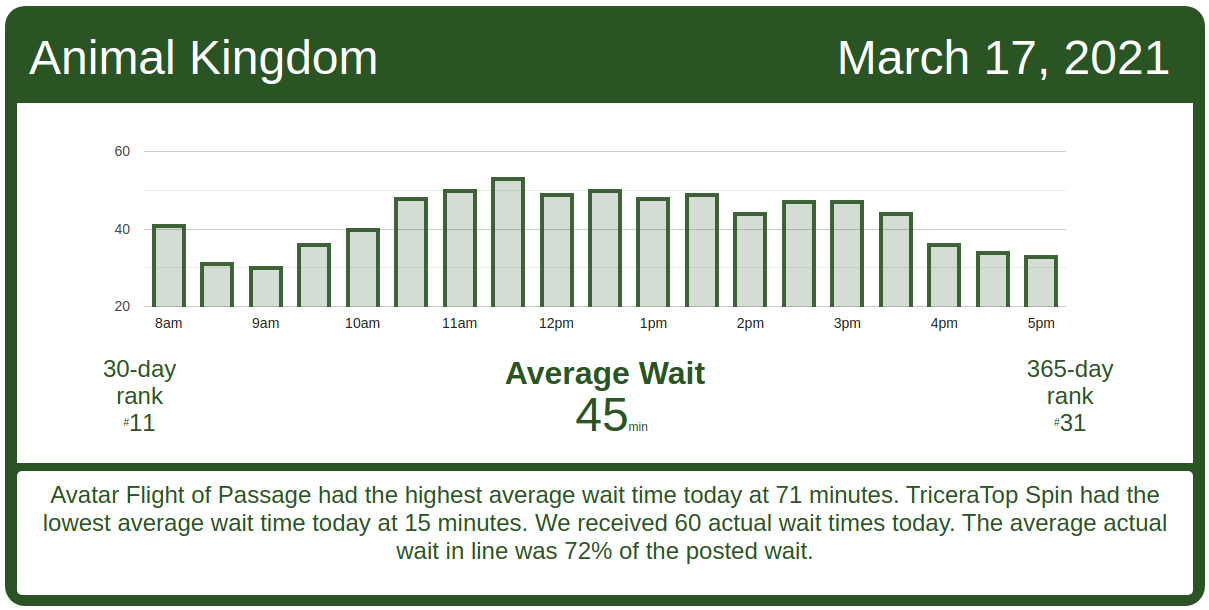
Animal Kingdom Wait Times

Avatar Flight of Passage had an average wait time today of 71 minutes. Its 7-day average is 71 minutes, so today ranks #3 for this week. Its 30-day average is 60 minutes, so today ranks #9 for the past month. Its 365-day average is 46 minutes, so today ranks #46 for the past year. We received 14 actual wait times today, and the actual wait averaged 75% of the posted wait time.

Animal Kingdom wait times for Wednesday, March 17, 2021
DINOSAUR
Average Posted Wait
53
Actual Waits Were
117%
7-Day Rank
#4
30-Day Rank
#13
365-Day Rank
#37
Expedition Everest – Legend of the Forbidden Mountain
Average Posted Wait
26
Actual Waits Were
60%
7-Day Rank
#4
30-Day Rank
#11
365-Day Rank
#99
Kilimanjaro Safaris
Average Posted Wait
46
Actual Waits Were
55%
7-Day Rank
#1
30-Day Rank
#2
365-Day Rank
#5
It’s Tough to Be a Bug!
Average Posted Wait
34
7-Day Rank
#1
30-Day Rank
#1
365-Day Rank
#4
TriceraTop Spin
Average Posted Wait
15
7-Day Rank
#1
30-Day Rank
#4
365-Day Rank
#5
Na’vi River Journey
Average Posted Wait
71
Actual Waits Were
93%
7-Day Rank
#4
30-Day Rank
#17
365-Day Rank
#30
Avatar Flight of Passage
Average Posted Wait
71
Actual Waits Were
75%
7-Day Rank
#3
30-Day Rank
#9
365-Day Rank
#46

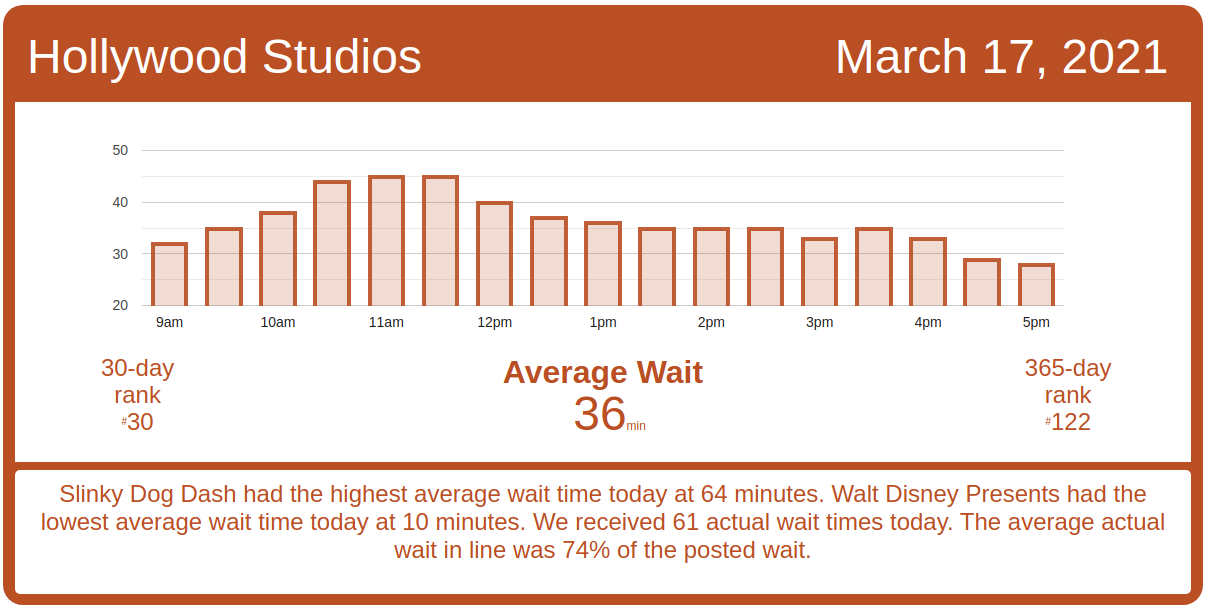
Hollywood Studios Wait Times

Toy Story Mania! had an average wait time today of 33 minutes. Its 7-day average is 34 minutes, so today ranks #6 for this week. Its 30-day average is 36 minutes, so today ranks #21 for the past month. Its 365-day average is 26 minutes, so today ranks #54 for the past year. We received 13 actual wait times today, and the actual wait averaged 65% of the posted wait time.

Hollywood Studios wait times for Wednesday, March 17, 2021

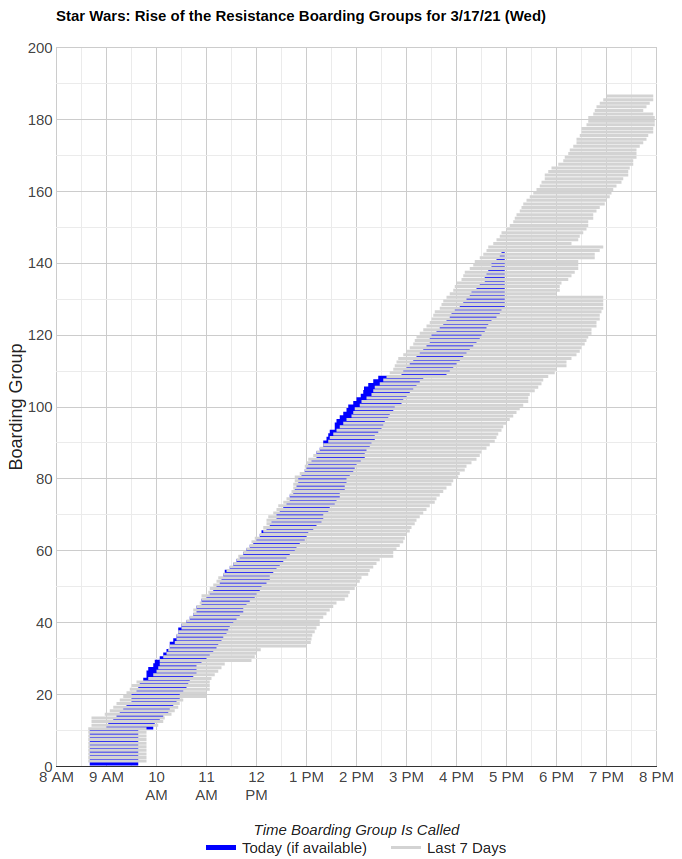
Rise of the Resistance seems to have run well today, with only one long outage – around 30 minutes at boarding group 109, just before 2:30 p.m.  Rise is on pace to hit boarding group 180 around 7:30 p.m.

Speaking of Rise, we counted 1,048 guests per hour exiting Rise of the Resistance today around noon.  Rise is calling around 20 boarding groups per hour, so the average number of people in a boarding group right now seems to be around 52 right now.  That works out to a maximum capacity of around 9,400 riders per day, assuming everything runs well.
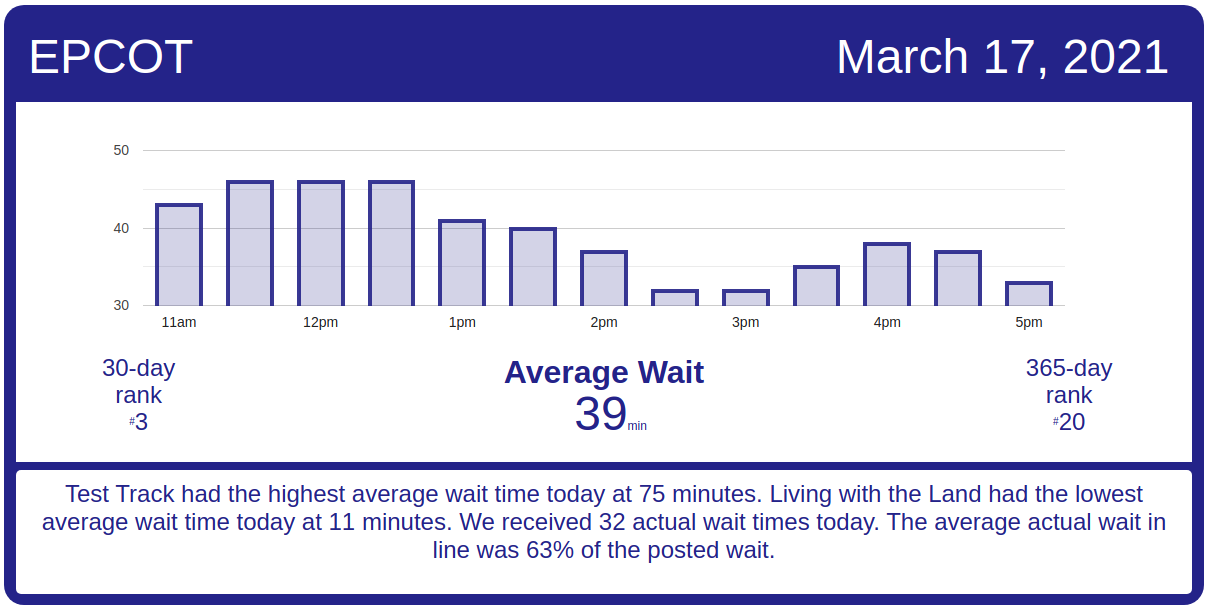
Rise of the Resistance boarding groups for Wednesday, March 17, 2021
Muppet*Vision 3D
Average Posted Wait
35
7-Day Rank
#1
30-Day Rank
#5
365-Day Rank
#10
Rock ‘n’ Roller Coaster Starring Aerosmith
Average Posted Wait
42
Actual Waits Were
74%
7-Day Rank
#6
30-Day Rank
#18
365-Day Rank
#125
Star Tours: The Adventures Continue
Average Posted Wait
31
Actual Waits Were
68%
7-Day Rank
#5
30-Day Rank
#23
365-Day Rank
#89
The Twilight Zone Tower of Terror
Average Posted Wait
53
Actual Waits Were
93%
7-Day Rank
#6
30-Day Rank
#28
365-Day Rank
#91
Toy Story Mania!
Average Posted Wait
33
Actual Waits Were
65%
7-Day Rank
#6
30-Day Rank
#21
365-Day Rank
#54
Walt Disney Presents
Average Posted Wait
10
7-Day Rank
#1
30-Day Rank
#1
365-Day Rank
#1
Slinky Dog Dash
Average Posted Wait
64
Actual Waits Were
65%
7-Day Rank
#6
30-Day Rank
#19
365-Day Rank
#101
Alien Swirling Saucers
Average Posted Wait
31
Actual Waits Were
53%
7-Day Rank
#2
30-Day Rank
#15
365-Day Rank
#35
Mickey & Minnie’s Runaway Railway
Average Posted Wait
36
Actual Waits Were
76%
7-Day Rank
#6
30-Day Rank
#30
365-Day Rank
#242
Millennium Falcon: Smugglers Run
Average Posted Wait
53
Actual Waits Were
98%
7-Day Rank
#6
30-Day Rank
#29
365-Day Rank
#126

EPCOT Wait Times

Soarin’ had an average wait time today of 72 minutes. Its 7-day average is 59 minutes, so today ranks #1 for this week. Its 30-day average is 46 minutes, so today ranks #1 for the past month. Its 365-day average is 33 minutes, so today ranks #6 for the past year. We received 7 actual wait times today, and the actual wait averaged 70% of the posted wait time.

EPCOT wait times for Wednesday, March 17, 2021
Gran Fiesta Tour Starring The Three Caballeros
Average Posted Wait
15
7-Day Rank
#1
30-Day Rank
#1
365-Day Rank
#19
Journey Into Imagination With Figment
Average Posted Wait
21
7-Day Rank
#1
30-Day Rank
#4
365-Day Rank
#41
Living with the Land
Average Posted Wait
11
7-Day Rank
#3
30-Day Rank
#8
365-Day Rank
#102
Mission: SPACE Orange
Average Posted Wait
56
Actual Waits Were
55%
7-Day Rank
#1
30-Day Rank
#1
365-Day Rank
#10
Soarin’
Average Posted Wait
72
Actual Waits Were
70%
7-Day Rank
#1
30-Day Rank
#1
365-Day Rank
#6
Spaceship Earth
Average Posted Wait
31
Actual Waits Were
43%
7-Day Rank
#3
30-Day Rank
#5
365-Day Rank
#22
Test Track
Average Posted Wait
75
7-Day Rank
#2
30-Day Rank
#4
365-Day Rank
#31
The Seas with Nemo & Friends
Average Posted Wait
19
7-Day Rank
#2
30-Day Rank
#3
365-Day Rank
#14
Mission: SPACE Green
Average Posted Wait
40
7-Day Rank
#1
30-Day Rank
#1
365-Day Rank
#7
Frozen Ever After
Average Posted Wait
54
Actual Waits Were
60%
7-Day Rank
#2
30-Day Rank
#2
365-Day Rank
#78

The post Solid Midweek Crowds – Disney World Wait Times for Wednesday, March 17, 2021 appeared first on TouringPlans.com Blog.