

Although we’ve been seeing Spring Break crowds in the parks this week, today’s posted wait times are in the middle of the past 30 days. Disney’s posted wait times were about 70% compared to the actual wait time data we captured today, which is about what we usually see. Splash Mountain reclaimed its title with the longest average posted wait time of the day at 81 minutes. We received 236 actual wait times from our Liners, the smart folks who subscribe to our Lines app, thank you Liners!!
Magic Kingdom Wait Times

Big Thunder Mountain Railroad had an average wait time today of 39 minutes. Its 7-day average is 44 minutes, so today ranks #5 for this week. Its 30-day average is 52 minutes, so today ranks #25 for the past month. We received 11 actual wait times today, and the actual wait averaged 25% of the posted wait time, so the average actual wait was about 10 minutes.
“it’s a small world” had an average wait time today of 45 minutes. Its 7-day average is 48 minutes, so today ranks #4 for this week. Its 30-day average is 46 minutes, so today ranks #20 for the past month. Its 365-day average is 34 minutes, so today ranks #42 for the past year.
Peter Pan’s Flight had an average wait time today of 42 minutes. Its 7-day average is 46 minutes, so today ranks #5 for this week. Its 30-day average is 42 minutes, so today ranks #18 for the past month. We received 6 actual wait times today, and the actual wait averaged 76% of the posted wait time, so the average actual wait was 32 minutes.
Pirates of the Caribbean had an average wait time today of 54 minutes. Its 7-day average is 59 minutes, so today ranks #4 for this week. Its 30-day average is 58 minutes, so today ranks #22 for the past month. We received 11 actual wait times today, and the actual wait averaged 82% of the posted wait time, so the average actual wait was 44 minutes.
Space Mountain had an average wait time today of 50 minutes. Its 7-day average is 52 minutes, so today ranks #5 for this week. Its 30-day average is 49 minutes, so today ranks #14 for the past month. Its 365-day average is 36 minutes, so today ranks #63 for the past year. We received 9 actual wait times today, and the actual wait averaged 60% of the posted wait time.
Splash Mountain had an average wait time today of 81 minutes. Its 7-day average is 74 minutes, so today ranks #3 for this week. Its 30-day average is 70 minutes, so today ranks #6 for the past month. Its 365-day average is 50 minutes, so today ranks #18 for the past year. We received 8 actual wait times today, and the actual wait averaged 75% of the posted wait time.
The Haunted Mansion had an average wait time today of 28 minutes. Its 7-day average is 33 minutes, so today ranks #5 for this week. Its 30-day average is 30 minutes, so today ranks #18 for the past month. We received 7 actual wait times today, and the actual wait averaged 44% of the posted wait time, so the average actual wait was 12 minutes.
Tomorrowland Speedway had an average wait time today of 18 minutes. Its 7-day average is 22 minutes, so today ranks #5 for this week. Its 30-day average is 21 minutes, so today ranks #18 for the past month. Its 365-day average is 16 minutes, so today ranks #81 for the past year.

Seven Dwarfs Mine Train had an average wait time today of 61 minutes. Its 7-day average is 65 minutes, so today ranks #5 for this week. Its 30-day average is 71 minutes, so today ranks #24 for the past month. Its 365-day average is 57 minutes, so today ranks #100 for the past year. We received 5 actual wait times today, and the actual wait averaged 79% of the posted wait time.
Under the Sea ~ Journey of the Little Mermaid had an average wait time today of 23 minutes. Its 7-day average is 28 minutes, so today ranks #6 for this week. Its 30-day average is 27 minutes, so today ranks #23 for the past month. We received 8 actual wait times today, and the actual wait averaged 57% of the posted wait time, so the average actual wait was 13 minutes.
EPCOT Wait Times

Gran Fiesta Tour Starring The Three Cardboard Caballeros had an average wait time today of 5 minutes. Its 7-day average is 8 minutes, so today ranks #6 for this week. Its 30-day average is 9 minutes, so today ranks #30 for the past month. Its 365-day average is 9 minutes, so today ranks #233 for the past year.
Living with the Land had an average wait time today of 8 minutes. Its 7-day average is 9 minutes, so today ranks #4 for this week. Its 30-day average is 9 minutes, so today ranks #16 for the past month. Its 365-day average is 11 minutes, so today ranks #195 for the past year.
Soarin’ had an average wait time today of 50 minutes. Its 7-day average is 50 minutes, so today ranks #4 for this week. Its 30-day average is 43 minutes, so today ranks #12 for the past month. Its 365-day average is 32 minutes, so today ranks #44 for the past year.
Spaceship Earth had an average wait time today of 32 minutes. Its 7-day average is 26 minutes, so today ranks #1 for this week. Its 30-day average is 23 minutes, so today ranks #4 for the past month. Its 365-day average is 17 minutes, so today ranks #15 for the past year.
Test Track had an average wait time today of 59 minutes. Its 7-day average is 56 minutes, so today ranks #2 for this week. Its 30-day average is 56 minutes, so today ranks #12 for the past month. Its 365-day average is 53 minutes, so today ranks #88 for the past year.
The Seas with Nemo & Friends had an average wait time today of 13 minutes. Its 7-day average is 14 minutes, so today ranks #3 for this week. Its 30-day average is 11 minutes, so today ranks #8 for the past month. Its 365-day average is 11 minutes, so today ranks #49 for the past year.
Frozen Ever After had an average wait time today of 32 minutes. Its 7-day average is 42 minutes, so today ranks #6 for this week. Its 30-day average is 35 minutes, so today ranks #17 for the past month. Its 365-day average is 45 minutes, so today ranks #152 for the past year.
Disney’s Hollywood Studios Wait Times

Rock ‘n’ Roller Coaster Starring Aerosmith had an average wait time today of 43 minutes. Its 7-day average is 50 minutes, so today ranks #5 for this week. Its 30-day average is 45 minutes, so today ranks #17 for the past month. We received 7 actual wait times today, and the actual wait averaged 73% of the posted wait time, so the average actual wait was 33 minutes.
Star Tours: The Adventures Continue had an average wait time today of 43 minutes. Its 7-day average is 44 minutes, so today ranks #4 for this week. Its 30-day average is 38 minutes, so today ranks #5 for the past month. Its 365-day average is 27 minutes, so today ranks #8 for the past year. We received 4 actual wait times today, and the actual wait averaged 77% of the posted wait time.
The Twilight Zone Tower of Terror had an average wait time today of 59 minutes. Its 7-day average is 74 minutes, so today ranks #6 for this week. Its 30-day average is 67 minutes, so today ranks #25 for the past month. Its 365-day average is 50 minutes, so today ranks #65 for the past year. We received 10 actual wait times today, and the actual wait averaged 72% of the posted wait time.
Toy Story Mania! had an average wait time today of 33 minutes. Its 7-day average is 38 minutes, so today ranks #5 for this week. Its 30-day average is 36 minutes, so today ranks #19 for the past month. Its 365-day average is 26 minutes, so today ranks #52 for the past year. We received 9 actual wait times today, and the actual wait averaged 84% of the posted wait time.
Slinky Dog Dash had an average wait time today of 64 minutes. Its 7-day average is 73 minutes, so today ranks #5 for this week. Its 30-day average is 68 minutes, so today ranks #18 for the past month. Its 365-day average is 58 minutes, so today ranks #97 for the past year.
Mickey & Minnie’s Runaway Railway had an average wait time today of 41 minutes. Its 7-day average is 50 minutes, so today ranks #6 for this week. Its 30-day average is 49 minutes, so today ranks #30 for the past month. We received 12 actual wait times today, and the actual wait averaged 78% of the posted wait time, so the average actual wait was 32 minutes.
Millennium Falcon: Smugglers Run had an average wait time today of 60 minutes. Its 7-day average is 66 minutes, so today ranks #6 for this week. Its 30-day average is 63 minutes, so today ranks #21 for the past month. Its 365-day average is 52 minutes, so today ranks #89 for the past year.
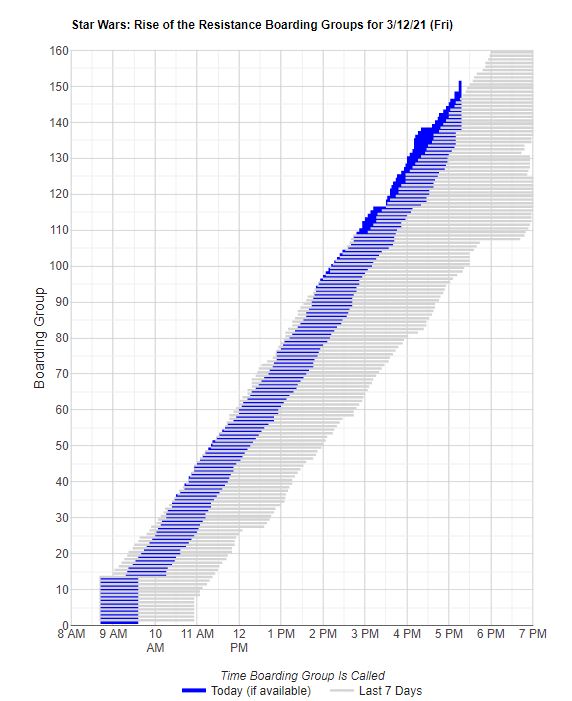
Rise of the Resistance is having a pretty great day with no real interruptions. It looks like it is above pace of the past 7 days. It will most likely reach or surpass boarding groups around 160.
Disney’s Animal Kingdom Wait Times

DINOSAUR had an average wait time today of 43 minutes. Its 7-day average is 56 minutes, so today ranks #5 for this week. Its 30-day average is 47 minutes, so today ranks #19 for the past month. Its 365-day average is 30 minutes, so today ranks #64 for the past year. We received 7 actual wait times today, and the actual wait averaged 125% of the posted wait time.
Expedition Everest – Legend of the Forbidden Mountain had an average wait time today of 21 minutes. Its 7-day average is 26 minutes, so today ranks #5 for this week. Its 30-day average is 23 minutes, so today ranks #15 for the past month. We received 20 actual wait times today, and the actual wait averaged 87% of the posted wait time, so the average actual wait was 18 minutes.
Kilimanjaro Safaris had an average wait time today of 22 minutes. Its 7-day average is 37 minutes, so today ranks #6 for this week. Its 30-day average is 31 minutes, so today ranks #23 for the past month. We received 14 actual wait times today, and the actual wait averaged 53% of the posted wait time, so the average actual wait was 12 minutes.
It’s Tough to Be a Bug! had an average wait time today of 32 minutes. Its 7-day average is 20 minutes, so today ranks #1 for this week. Its 30-day average is 24 minutes, so today ranks #3 for the past month. Its 365-day average is 15 minutes, so today ranks #12 for the past year.
Na’vi River Journey had an average wait time today of 69 minutes. Its 7-day average is 89 minutes, so today ranks #5 for this week. Its 30-day average is 73 minutes, so today ranks #17 for the past month. Its 365-day average is 45 minutes, so today ranks #32 for the past year. We received 10 actual wait times today, and the actual wait averaged 85% of the posted wait time.
Avatar Flight of Passage had an average wait time today of 53 minutes. Its 7-day average is 72 minutes, so today ranks #5 for this week. Its 30-day average is 60 minutes, so today ranks #18 for the past month. Its 365-day average is 47 minutes, so today ranks #96 for the past year. We received 21 actual wait times today, and the actual wait averaged 79% of the posted wait time.
The post Middle of the Road – Disney World Wait Times for Friday, March 12, 2021 appeared first on TouringPlans.com Blog.