Busy Midweek – Disney World Wait Times for Wednesday, March 10, 2021

Wait times at all four Walt Disney World parks were near their highs for the past month today, as pleasant weather and Spring Break combined to bring families out to the parks.  Average posted wait times at the Magic Kingdom, Animal Kingdom, and Hollywood Studios were at their second-highest levels of the past 30 days, while EPCOT’s waits currently stand at #4 for the past month.

We counted 487 of 500 guests (96%) at Magic Kingdom wearing masks according to Disney’s mask guidelines.  And we’ve got 184 actual wait times so far from our fabulous Lines community! Let’s do the rest of the numbers!

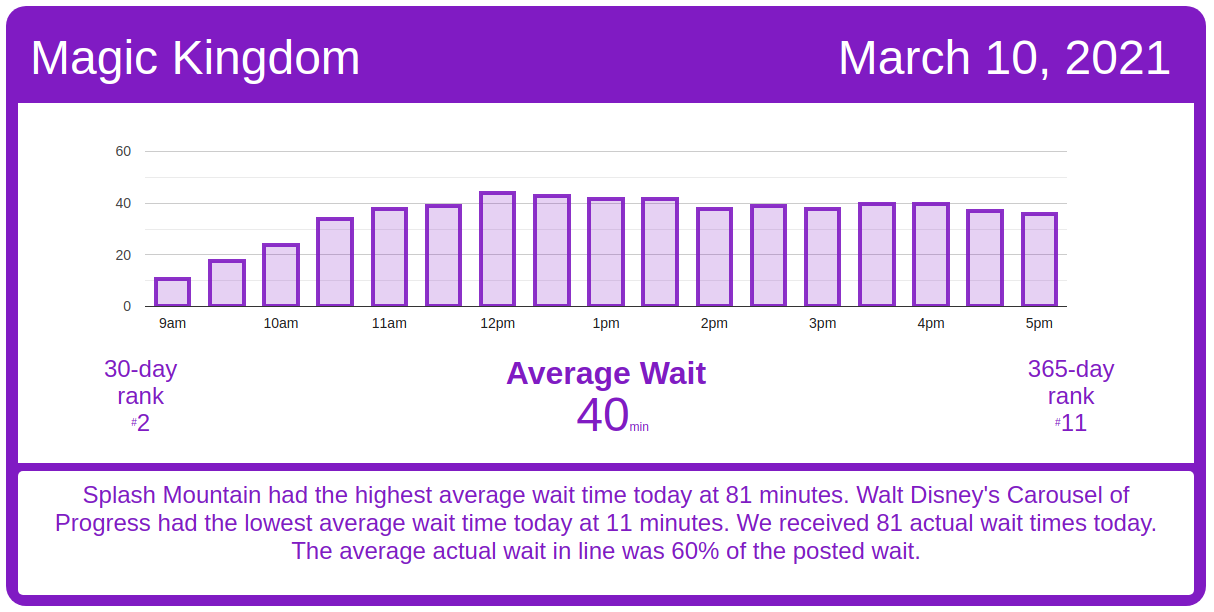
Magic Kingdom Wait Times

Space Mountain had an average wait time today of 55 minutes. Its 7-day average is 49 minutes, so today ranks #2 for this week. Its 30-day average is 47 minutes, so today ranks #10 for the past month. Its 365-day average is 36 minutes, so today ranks #42 for the past year. We received 10 actual wait times today, and the actual wait averaged 65% of the posted wait time.

Magic Kingdom wait times for Wednesday, March 10, 2021
Astro Orbiter
Average Posted Wait
51
7-Day Rank
#1
30-Day Rank
#1
365-Day Rank
#1
Big Thunder Mountain Railroad
Average Posted Wait
45
Actual Waits Were
26%
7-Day Rank
#4
30-Day Rank
#21
365-Day Rank
#116
Buzz Lightyear’s Space Ranger Spin
Average Posted Wait
44
Actual Waits Were
52%
7-Day Rank
#2
30-Day Rank
#12
365-Day Rank
#25
Prince Charming Regal Carrousel
Average Posted Wait
45
7-Day Rank
#1
30-Day Rank
#1
365-Day Rank
#1
Country Bear Jamboree
Average Posted Wait
30
7-Day Rank
#1
30-Day Rank
#1
365-Day Rank
#1
Dumbo the Flying Elephant
Average Posted Wait
26
7-Day Rank
#3
30-Day Rank
#9
365-Day Rank
#16
“it’s a small world”
Average Posted Wait
55
7-Day Rank
#1
30-Day Rank
#1
365-Day Rank
#4
Jungle Cruise
Average Posted Wait
49
Actual Waits Were
74%
7-Day Rank
#2
30-Day Rank
#10
365-Day Rank
#35
Mad Tea Party
Average Posted Wait
24
7-Day Rank
#2
30-Day Rank
#4
365-Day Rank
#8
Mickey’s PhilharMagic
Average Posted Wait
32
7-Day Rank
#1
30-Day Rank
#2
365-Day Rank
#15
Peter Pan’s Flight
Average Posted Wait
48
7-Day Rank
#2
30-Day Rank
#5
365-Day Rank
#17
Pirates of the Caribbean
Average Posted Wait
61
Actual Waits Were
112%
7-Day Rank
#2
30-Day Rank
#8
365-Day Rank
#16
Tom Sawyer Island
Average Posted Wait
41
7-Day Rank
#1
30-Day Rank
#1
365-Day Rank
#1
Space Mountain
Average Posted Wait
55
Actual Waits Were
65%
7-Day Rank
#2
30-Day Rank
#10
365-Day Rank
#42
Splash Mountain
Average Posted Wait
81
Actual Waits Were
61%
7-Day Rank
#1
30-Day Rank
#4
365-Day Rank
#18
The Barnstormer
Average Posted Wait
22
7-Day Rank
#4
30-Day Rank
#21
365-Day Rank
#90
The Haunted Mansion
Average Posted Wait
34
Actual Waits Were
57%
7-Day Rank
#3
30-Day Rank
#7
365-Day Rank
#68
The Magic Carpets of Aladdin
Average Posted Wait
22
7-Day Rank
#2
30-Day Rank
#8
365-Day Rank
#14
The Many Adventures of Winnie the Pooh
Average Posted Wait
33
7-Day Rank
#2
30-Day Rank
#6
365-Day Rank
#18
Tomorrowland Speedway
Average Posted Wait
20
Actual Waits Were
61%
7-Day Rank
#4
30-Day Rank
#14
365-Day Rank
#60
Seven Dwarfs Mine Train
Average Posted Wait
66
Actual Waits Were
68%
7-Day Rank
#2
30-Day Rank
#15
365-Day Rank
#82
Under the Sea ~ Journey of the Little Mermaid
Average Posted Wait
30
Actual Waits Were
64%
7-Day Rank
#1
30-Day Rank
#6
365-Day Rank
#30

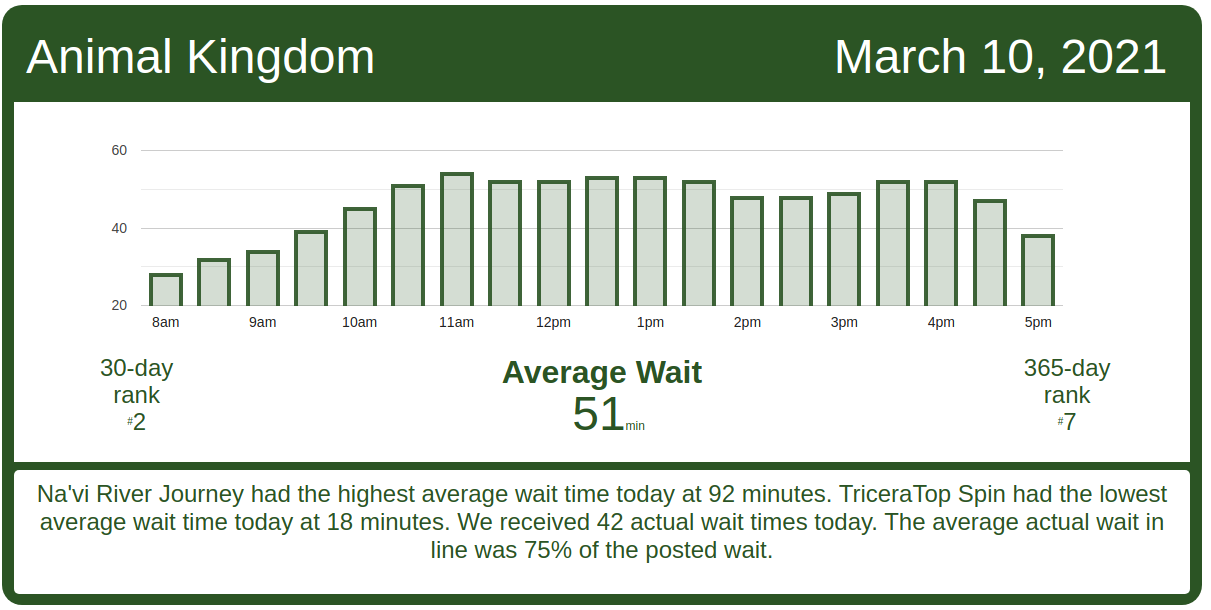
Animal Kingdom Wait Times

Kilimanjaro Safaris had an average wait time today of 29 minutes. Its 7-day average is 32 minutes, so today ranks #3 for this week. Its 30-day average is 29 minutes, so today ranks #14 for the past month. Its 365-day average is 21 minutes, so today ranks #49 for the past year. We received 8 actual wait times today, and the actual wait averaged 43% of the posted wait time.

Animal Kingdom wait times for Wednesday, March 10, 2021
DINOSAUR
Average Posted Wait
57
Actual Waits Were
80%
7-Day Rank
#2
30-Day Rank
#5
365-Day Rank
#23
Expedition Everest – Legend of the Forbidden Mountain
Average Posted Wait
23
Actual Waits Were
68%
7-Day Rank
#3
30-Day Rank
#13
365-Day Rank
#122
Kilimanjaro Safaris
Average Posted Wait
29
Actual Waits Were
43%
7-Day Rank
#3
30-Day Rank
#14
365-Day Rank
#49
TriceraTop Spin
Average Posted Wait
18
7-Day Rank
#1
30-Day Rank
#1
365-Day Rank
#1
Wildlife Express Train: Africa Station
Average Posted Wait
68
7-Day Rank
#1
30-Day Rank
#1
365-Day Rank
#1
Na’vi River Journey
Average Posted Wait
92
Actual Waits Were
85%
7-Day Rank
#2
30-Day Rank
#3
365-Day Rank
#4
Avatar Flight of Passage
Average Posted Wait
83
Actual Waits Were
83%
7-Day Rank
#1
30-Day Rank
#3
365-Day Rank
#29

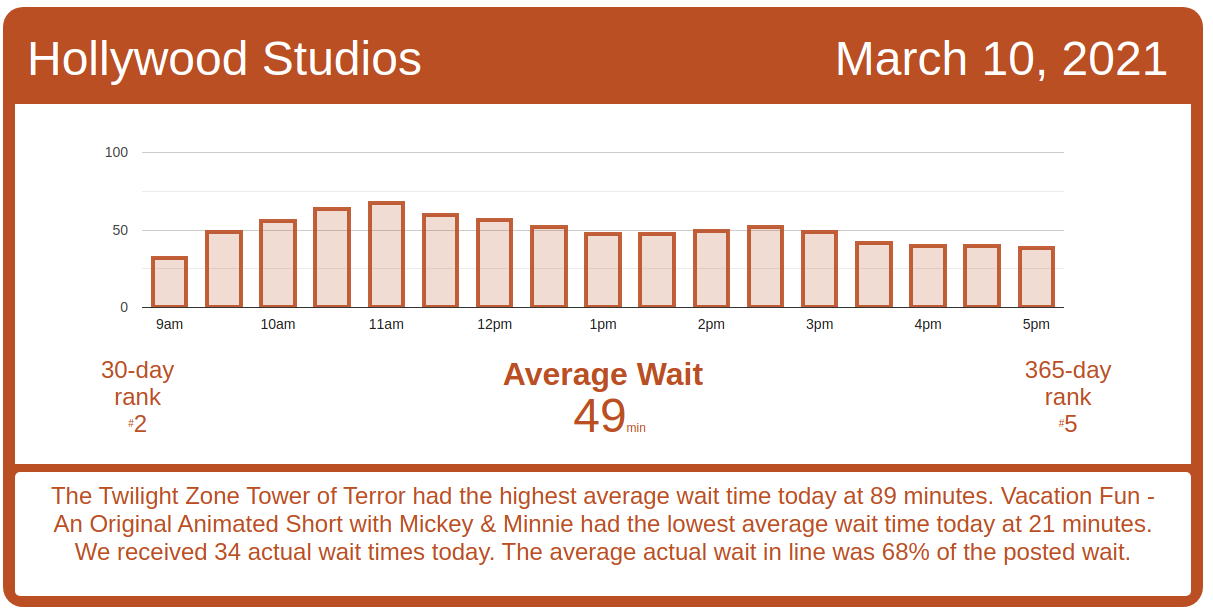
Hollywood Studios Wait Times

Mickey & Minnie’s Runaway Railway had an average wait time today of 54 minutes. Its 7-day average is 49 minutes, so today ranks #1 for this week. Its 30-day average is 49 minutes, so today ranks #5 for the past month. Its 365-day average is 58 minutes, so today ranks #114 for the past year. We received 6 actual wait times today, and the actual wait averaged 73% of the posted wait time.

Hollywood Studios wait times for Wednesday, March 10, 2021

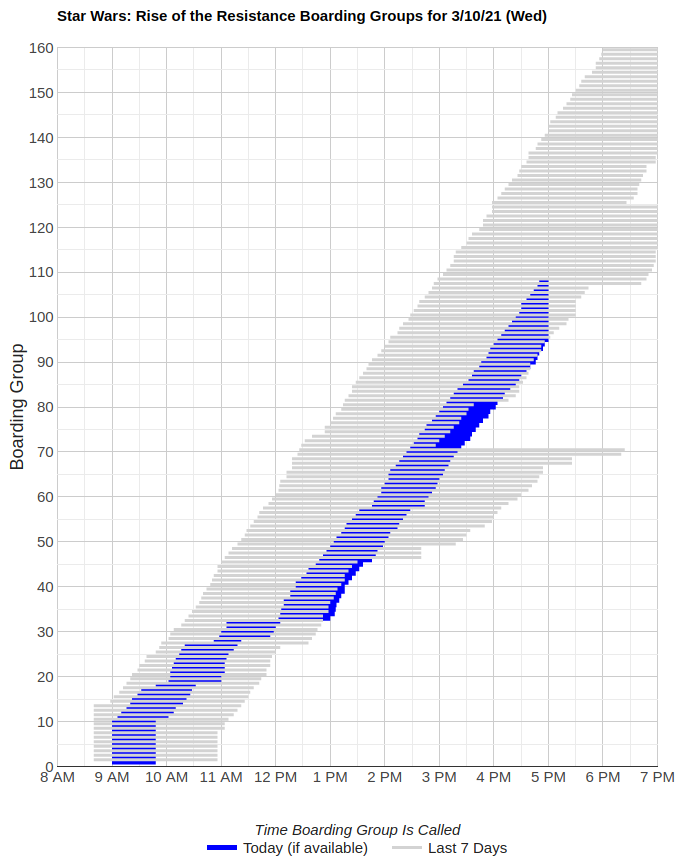
Rise of the Resistance started calling boarding groups at 9:00 a.m. today, a little later than normal.  And Rise had a rough morning, with a 30-minute delay between calling boarding groups 27 and 29, and another delay of almost an hour around 11:00 a.m., between boarding group 32 and boarding group 33.  Rise is at boarding group 108 as I write this, and is running at the tail end of their average progress for the past week.
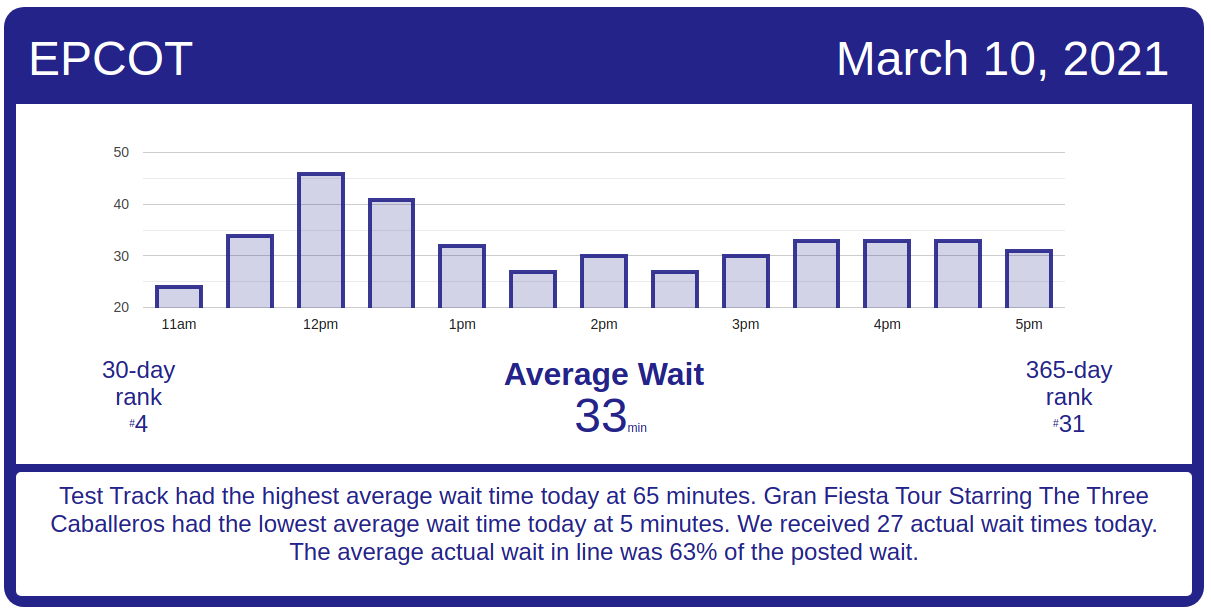
Rise of the Resistance boarding groups for Wednesday, March 10, 2021
Muppet*Vision 3D
Average Posted Wait
37
Actual Waits Were
64%
7-Day Rank
#1
30-Day Rank
#1
365-Day Rank
#2
Rock ‘n’ Roller Coaster Starring Aerosmith
Average Posted Wait
53
Actual Waits Were
73%
7-Day Rank
#2
30-Day Rank
#3
365-Day Rank
#42
Star Tours: The Adventures Continue
Average Posted Wait
51
7-Day Rank
#1
30-Day Rank
#1
365-Day Rank
#1
The Twilight Zone Tower of Terror
Average Posted Wait
89
7-Day Rank
#1
30-Day Rank
#1
365-Day Rank
#1
Toy Story Mania!
Average Posted Wait
42
Actual Waits Were
52%
7-Day Rank
#1
30-Day Rank
#3
365-Day Rank
#10
Walt Disney Presents
Average Posted Wait
22
7-Day Rank
#1
30-Day Rank
#1
365-Day Rank
#1
Slinky Dog Dash
Average Posted Wait
83
Actual Waits Were
59%
7-Day Rank
#1
30-Day Rank
#2
365-Day Rank
#9
Alien Swirling Saucers
Average Posted Wait
39
7-Day Rank
#1
30-Day Rank
#2
365-Day Rank
#4
Mickey & Minnie’s Runaway Railway
Average Posted Wait
54
Actual Waits Were
73%
7-Day Rank
#1
30-Day Rank
#5
365-Day Rank
#114
Millennium Falcon: Smugglers Run
Average Posted Wait
67
Actual Waits Were
79%
7-Day Rank
#2
30-Day Rank
#8
365-Day Rank
#37

EPCOT Wait Times

Soarin’ had an average wait time today of 60 minutes. Its 7-day average is 43 minutes, so today ranks #1 for this week. Its 30-day average is 41 minutes, so today ranks #4 for the past month. Its 365-day average is 32 minutes, so today ranks #17 for the past year. We received 8 actual wait times today, and the actual wait averaged 68% of the posted wait time.

EPCOT wait times for Wednesday, March 10, 2021
Gran Fiesta Tour Starring The Three Caballeros
Average Posted Wait
5
7-Day Rank
#6
30-Day Rank
#29
365-Day Rank
#232
Journey Into Imagination With Figment
Average Posted Wait
16
Actual Waits Were
53%
7-Day Rank
#1
30-Day Rank
#10
365-Day Rank
#71
Living with the Land
Average Posted Wait
16
7-Day Rank
#1
30-Day Rank
#1
365-Day Rank
#27
Mission: SPACE Orange
Average Posted Wait
45
7-Day Rank
#1
30-Day Rank
#3
365-Day Rank
#22
Soarin’
Average Posted Wait
60
Actual Waits Were
68%
7-Day Rank
#1
30-Day Rank
#4
365-Day Rank
#17
Spaceship Earth
Average Posted Wait
31
7-Day Rank
#1
30-Day Rank
#4
365-Day Rank
#22
Test Track
Average Posted Wait
65
7-Day Rank
#1
30-Day Rank
#9
365-Day Rank
#63
The Seas with Nemo & Friends
Average Posted Wait
14
7-Day Rank
#1
30-Day Rank
#5
365-Day Rank
#37
Frozen Ever After
Average Posted Wait
46
7-Day Rank
#1
30-Day Rank
#5
365-Day Rank
#100

The post Busy Midweek – Disney World Wait Times for Wednesday, March 10, 2021 appeared first on TouringPlans.com Blog.