Crowds Moderate – Disney World Wait Times for Monday, February 22, 2021

Crowds dipped a bit from their weekend peaks as we start the week at Walt Disney World.  The average posted wait times at the Magic Kingdom were the 8th-highest of the past month, and that was tops for all four parks.

Although posted wait times were moderate, our Lines community was all over Walt Disney World today – we’ve got 155 actual wait times so far today!  We also counted 484 of 500 guests (97%) at EPCOT wearing masks according to Disney’s guidelines.  Let’s do the rest of the numbers!

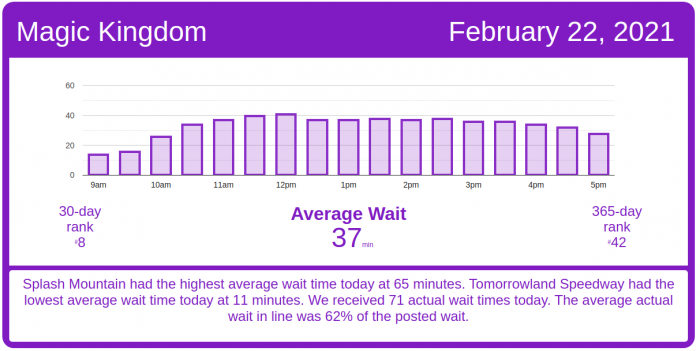
Magic Kingdom Wait Times

It looks like posted wait times were inflated a bit at the Magic Kingdom today.  Of the 71 actual wait times we’ve received so far in that park, the average actual wait time has been just 62% of the posted wait.  It should be closer to 80%.  At 62%, a posted wait of 60 minutes at Splash Mountain would mean an actual wait of about 37 minutes.

Big Thunder Mountain Railroad had a big gap in its actual vs posted waits – the average posted wait time today was 45 minutes. We received 8 actual wait times today, and the actual wait averaged 38% of the posted wait time.  So for an average posted wait of 45 minutes, the actual wait would’ve been around 17 minutes.

Magic Kingdom wait times for Monday, February 22, 2021
Astro Orbiter
Average Posted Wait
43
7-Day Rank
#4
30-Day Rank
#9
365-Day Rank
#22
Big Thunder Mountain Railroad
Average Posted Wait
45
Actual Waits Were
38%
7-Day Rank
#6
30-Day Rank
#16
365-Day Rank
#121
Buzz Lightyear’s Space Ranger Spin
Average Posted Wait
42
Actual Waits Were
52%
7-Day Rank
#5
30-Day Rank
#9
365-Day Rank
#45
Dumbo the Flying Elephant
Average Posted Wait
21
7-Day Rank
#4
30-Day Rank
#10
365-Day Rank
#45
“it’s a small world”
Average Posted Wait
44
7-Day Rank
#7
30-Day Rank
#11
365-Day Rank
#48
Jungle Cruise
Average Posted Wait
46
7-Day Rank
#4
30-Day Rank
#11
365-Day Rank
#64
Mickey’s PhilharMagic
Average Posted Wait
27
7-Day Rank
#6
30-Day Rank
#11
365-Day Rank
#49
Peter Pan’s Flight
Average Posted Wait
37
Actual Waits Were
78%
7-Day Rank
#6
30-Day Rank
#12
365-Day Rank
#97
Pirates of the Caribbean
Average Posted Wait
62
7-Day Rank
#3
30-Day Rank
#6
365-Day Rank
#14
Space Mountain
Average Posted Wait
40
Actual Waits Were
65%
7-Day Rank
#6
30-Day Rank
#12
365-Day Rank
#113
Splash Mountain
Average Posted Wait
65
Actual Waits Were
59%
7-Day Rank
#4
30-Day Rank
#8
365-Day Rank
#53
The Barnstormer
Average Posted Wait
30
7-Day Rank
#5
30-Day Rank
#10
365-Day Rank
#42
The Haunted Mansion
Average Posted Wait
27
Actual Waits Were
44%
7-Day Rank
#6
30-Day Rank
#11
365-Day Rank
#126
The Magic Carpets of Aladdin
Average Posted Wait
18
Actual Waits Were
38%
7-Day Rank
#6
30-Day Rank
#11
365-Day Rank
#42
The Many Adventures of Winnie the Pooh
Average Posted Wait
27
Actual Waits Were
78%
7-Day Rank
#6
30-Day Rank
#11
365-Day Rank
#83
Tomorrowland Speedway
Average Posted Wait
11
7-Day Rank
#6
30-Day Rank
#21
365-Day Rank
#177
Seven Dwarfs Mine Train
Average Posted Wait
64
Actual Waits Were
82%
7-Day Rank
#6
30-Day Rank
#11
365-Day Rank
#96
Under the Sea ~ Journey of the Little Mermaid
Average Posted Wait
21
Actual Waits Were
40%
7-Day Rank
#6
30-Day Rank
#15
365-Day Rank
#122

Animal Kingdom Wait Times

At the other end of the spectrum, Avatar: Flight of Passage had an average posted wait time today of 38 minutes. We received 8 actual wait times today, and the actual wait averaged 111% of the posted wait time.

Animal Kingdom wait times for Monday, February 22, 2021
DINOSAUR
Average Posted Wait
29
Actual Waits Were
85%
7-Day Rank
#6
30-Day Rank
#18
365-Day Rank
#120
Expedition Everest – Legend of the Forbidden Mountain
Average Posted Wait
15
Actual Waits Were
59%
7-Day Rank
#6
30-Day Rank
#18
365-Day Rank
#203
Kilimanjaro Safaris
Average Posted Wait
13
Actual Waits Were
39%
7-Day Rank
#6
30-Day Rank
#20
365-Day Rank
#180
It’s Tough to Be a Bug!
Average Posted Wait
19
7-Day Rank
#5
30-Day Rank
#9
365-Day Rank
#61
TriceraTop Spin
Average Posted Wait
5
7-Day Rank
#4
30-Day Rank
#8
365-Day Rank
#70
Na’vi River Journey
Average Posted Wait
55
Actual Waits Were
91%
7-Day Rank
#6
30-Day Rank
#12
365-Day Rank
#69
Avatar Flight of Passage
Average Posted Wait
38
Actual Waits Were
111%
7-Day Rank
#6
30-Day Rank
#13
365-Day Rank
#144

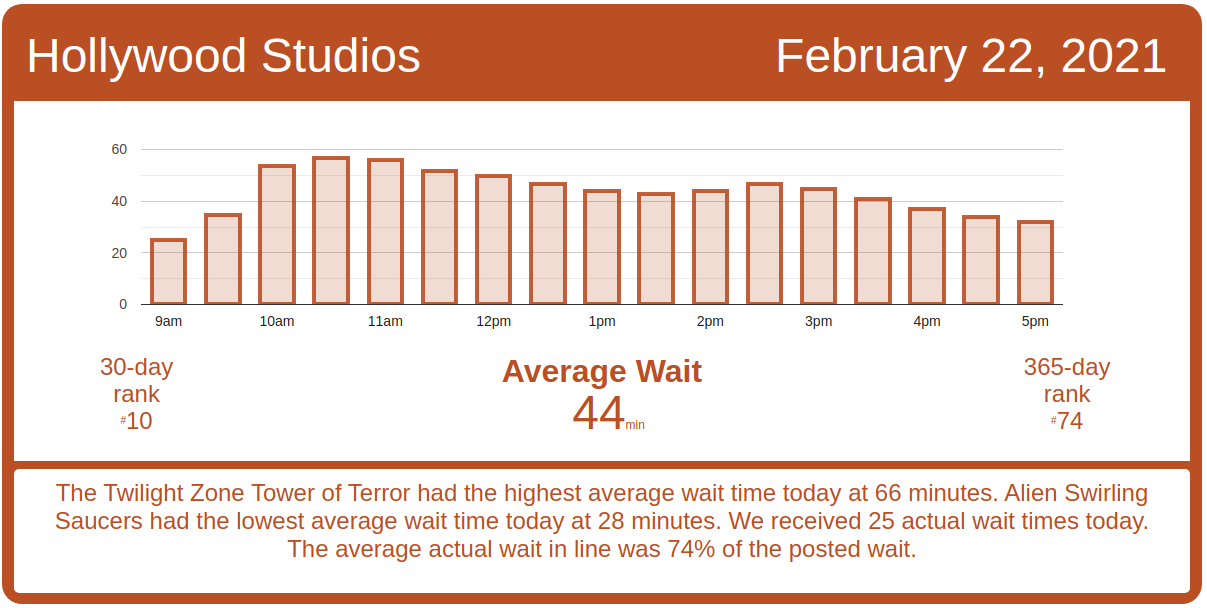
Hollywood Studios Wait Times

Tower of Terror continues to run at reduced capacity.  Over on Hollywood Boulevard, Mickey & Minnie’s Runaway Railway had an average wait time today of 50 minutes. Its 7-day average is 55 minutes, so today ranks #7 for this week. Its 30-day average is 45 minutes, so today ranks #9 for the past month. Its 365-day average is 60 minutes, so today ranks #149 for the past year. We received 9 actual wait times today, and the actual wait averaged 71% of the posted wait time.

Hollywood Studios wait times for Monday, February 22, 2021

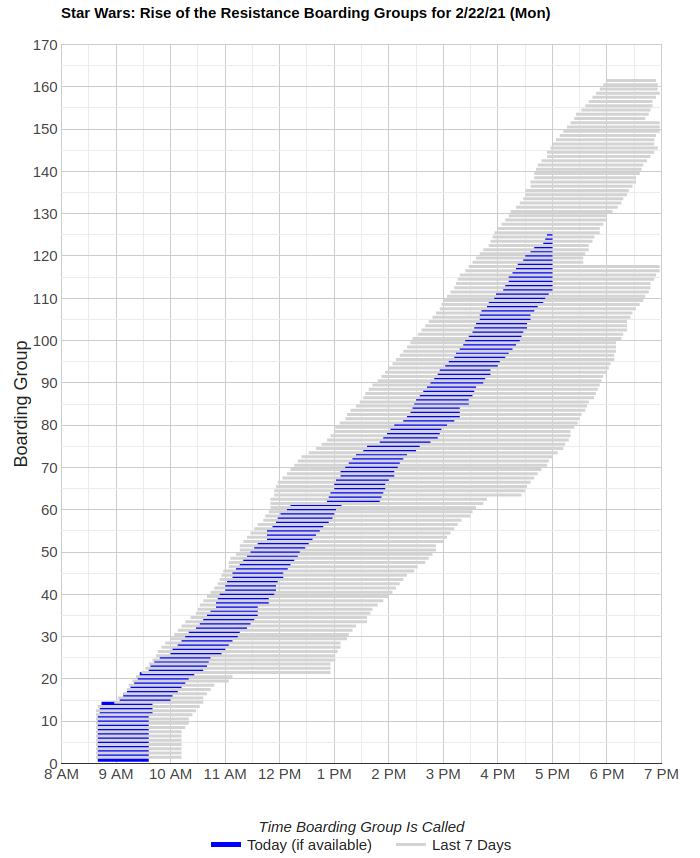
Rise of the Resistance has had a decent day of operations.  Rise of the Resistance began calling boarding groups at 8:45 a.m. with groups 1 through 11.  Everything ran smoothly until boarding group 61 around 12:10 p.m.  There was a delay in Rise calling boarding group 62 until around 12:50 p.m.  Since Rise began calling boarding groups again, the ride has continued to run smoothly; it looks like Rise will be able to get to boarding group 150 or better before the end of the evening.
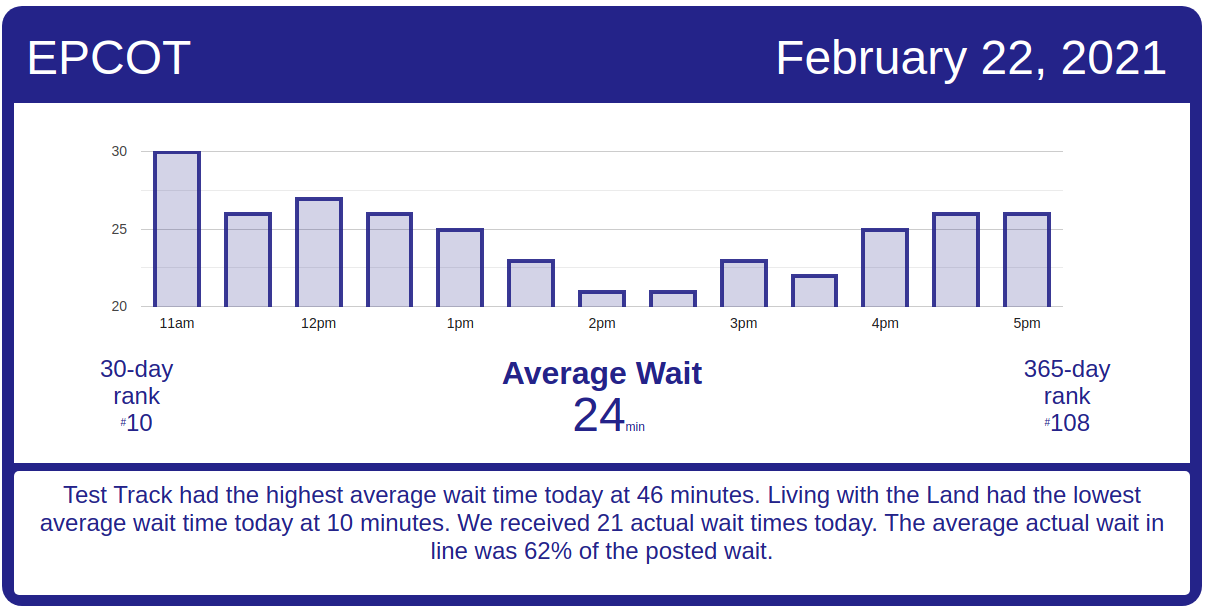
Rise of the Resistance boarding groups for Monday, February 22, 2021
Muppet*Vision 3D
Average Posted Wait
35
7-Day Rank
#1
30-Day Rank
#1
365-Day Rank
#5
Rock ‘n’ Roller Coaster Starring Aerosmith
Average Posted Wait
38
7-Day Rank
#6
30-Day Rank
#12
365-Day Rank
#152
Star Tours: The Adventures Continue
Average Posted Wait
38
7-Day Rank
#4
30-Day Rank
#5
365-Day Rank
#30
The Twilight Zone Tower of Terror
Average Posted Wait
66
7-Day Rank
#5
30-Day Rank
#6
365-Day Rank
#35
Toy Story Mania!
Average Posted Wait
31
Actual Waits Were
97%
7-Day Rank
#6
30-Day Rank
#10
365-Day Rank
#68
Slinky Dog Dash
Average Posted Wait
63
Actual Waits Were
73%
7-Day Rank
#6
30-Day Rank
#10
365-Day Rank
#118
Alien Swirling Saucers
Average Posted Wait
28
7-Day Rank
#6
30-Day Rank
#10
365-Day Rank
#69
Mickey & Minnie’s Runaway Railway
Average Posted Wait
50
Actual Waits Were
71%
7-Day Rank
#7
30-Day Rank
#9
365-Day Rank
#149
Millennium Falcon: Smugglers Run
Average Posted Wait
60
7-Day Rank
#7
30-Day Rank
#11
365-Day Rank
#93

EPCOT Wait Times

Test Track had an average wait time today of 46 minutes. Its 7-day average is 74 minutes, so today ranks #6 for this week. Its 30-day average is 55 minutes, so today ranks #15 for the past month. Its 365-day average is 55 minutes, so today ranks #150 for the past year. We received 4 actual wait times today, and the actual wait averaged 57% of the posted wait time.

EPCOT wait times for Monday, February 22, 2021
Gran Fiesta Tour Starring The Three Caballeros
Average Posted Wait
15
7-Day Rank
#1
30-Day Rank
#2
365-Day Rank
#22
Journey Into Imagination With Figment
Average Posted Wait
18
7-Day Rank
#6
30-Day Rank
#9
365-Day Rank
#64
Living with the Land
Average Posted Wait
10
Actual Waits Were
33%
7-Day Rank
#4
30-Day Rank
#7
365-Day Rank
#147
Mission: SPACE Orange
Average Posted Wait
35
7-Day Rank
#5
30-Day Rank
#7
365-Day Rank
#52
Soarin’
Average Posted Wait
36
Actual Waits Were
60%
7-Day Rank
#6
30-Day Rank
#10
365-Day Rank
#94
Spaceship Earth
Average Posted Wait
19
Actual Waits Were
72%
7-Day Rank
#6
30-Day Rank
#13
365-Day Rank
#97
Test Track
Average Posted Wait
46
Actual Waits Were
57%
7-Day Rank
#6
30-Day Rank
#15
365-Day Rank
#150
The Seas with Nemo & Friends
Average Posted Wait
11
7-Day Rank
#4
30-Day Rank
#8
365-Day Rank
#94
Frozen Ever After
Average Posted Wait
35
7-Day Rank
#5
30-Day Rank
#8
365-Day Rank
#152

The post Crowds Moderate – Disney World Wait Times for Monday, February 22, 2021 appeared first on TouringPlans.com Blog.