
Now that the busy February holidays are behind us, we are seeing Disney’s posted wait times come back down a little. All four parks except Magic Kingdom did not break the top 10 of the past 30 days. Magic Kingdom’s average wait times today rank at #1 of the past 30 days. Disney’s posted wait times were about as accurate as we’re used to seeing compared to actual wait time data, which is in the 70% range. EPCOT’s posted wait times were not as accurate, wait actual wait times reporting at 54% of the posted time. Also at EPCOT today our team counted 496 out of 500 guests (99%) that were wearing this masks in accordance with Disney’s guidelines. Let’s do the numbers!
Magic Kingdom Wait Times

Astro Orbiter had an average wait time today of 46 minutes. Its 7-day average is 44 minutes, so today ranks #2 for this week. Its 30-day average is 38 minutes, so today ranks #5 for the past month. Its 365-day average is 31 minutes, so today ranks #12 for the past year.
Big Thunder Mountain Railroad had an average wait time today of 57 minutes. Its 7-day average is 61 minutes, so today ranks #4 for this week. Its 30-day average is 48 minutes, so today ranks #8 for the past month. Its 365-day average is 45 minutes, so today ranks #47 for the past year. We received 7 actual wait times today, and the actual wait averaged 61% of the posted wait time.
“it’s a small world” had an average wait time today of 47 minutes. Its 7-day average is 49 minutes, so today ranks #6 for this week. Its 30-day average is 39 minutes, so today ranks #10 for the past month. Its 365-day average is 34 minutes, so today ranks #28 for the past year.
Jungle Cruise had an average wait time today of 51 minutes. Its 7-day average is 48 minutes, so today ranks #1 for this week. Its 30-day average is 43 minutes, so today ranks #3 for the past month. Its 365-day average is 41 minutes, so today ranks #32 for the past year.
Peter Pan’s Flight had an average wait time today of 43 minutes. Its 7-day average is 44 minutes, so today ranks #3 for this week. Its 30-day average is 34 minutes, so today ranks #6 for the past month. Its 365-day average is 35 minutes, so today ranks #48 for the past year.
Space Mountain had an average wait time today of 49 minutes. Its 7-day average is 55 minutes, so today ranks #5 for this week. Its 30-day average is 38 minutes, so today ranks #10 for the past month. Its 365-day average is 39 minutes, so today ranks #78 for the past year.
Splash Mountain had an average wait time today of 70 minutes. Its 7-day average is 69 minutes, so today ranks #2 for this week. Its 30-day average is 51 minutes, so today ranks #6 for the past month. We received 4 actual wait times today, and the actual wait averaged 80% of the posted wait time, meaning the average actual wait was 56 minutes.
The Haunted Mansion had an average wait time today of 33 minutes. Its 7-day average is 31 minutes, so today ranks #1 for this week. Its 30-day average is 23 minutes, so today ranks #4 for the past month. Its 365-day average is 30 minutes, so today ranks #77 for the past year.
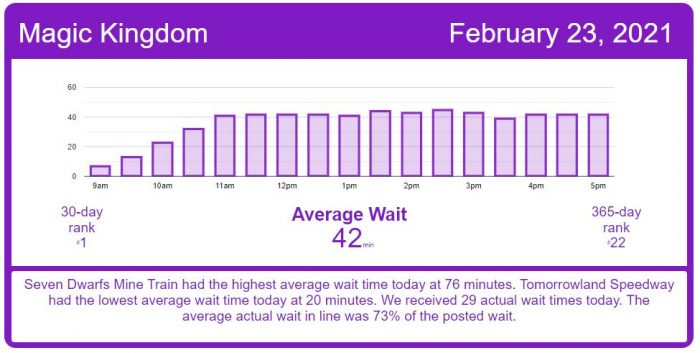
Tomorrowland Speedway had an average wait time today of 20 minutes. Its 7-day average is 21 minutes, so today ranks #4 for this week. Its 30-day average is 17 minutes, so today ranks #11 for the past month. Its 365-day average is 17 minutes, so today ranks #69 for the past year.
Seven Dwarfs Mine Train had an average wait time today of 76 minutes. Its 7-day average is 81 minutes, so today ranks #5 for this week. Its 30-day average is 64 minutes, so today ranks #9 for the past month. Its 365-day average is 60 minutes, so today ranks #54 for the past year.
Under the Sea ~ Journey of the Little Mermaid had an average wait time today of 31 minutes. Its 7-day average is 28 minutes, so today ranks #2 for this week. Its 30-day average is 21 minutes, so today ranks #4 for the past month. Its 365-day average is 20 minutes, so today ranks #35 for the past year.
EPCOT Wait Times

Gran Fiesta Tour Starring The Three Caballeros had an average wait time today of 10 minutes. Its 7-day average is 11 minutes, so today ranks #4 for this week. Its 30-day average is 8 minutes, so today ranks #9 for the past month. Its 365-day average is 9 minutes, so today ranks #96 for the past year.
Journey Into Imagination With Figment had an average wait time today of 9 minutes. Its 7-day average is 20 minutes, so today ranks #6 for this week. Its 30-day average is 13 minutes, so today ranks #20 for the past month. Its 365-day average is 13 minutes, so today ranks #149 for the past year.
Soarin’ had an average wait time today of 28 minutes. Its 7-day average is 50 minutes, so today ranks #6 for this week. Its 30-day average is 33 minutes, so today ranks #14 for the past month. We received 4 actual wait times today, and the actual wait averaged 73% of the posted wait time, meaning the average actual wait was 21 minutes.
Spaceship Earth had an average wait time today of 12 minutes. Its 7-day average is 27 minutes, so today ranks #6 for this week. Its 30-day average is 19 minutes, so today ranks #22 for the past month. Its 365-day average is 17 minutes, so today ranks #162 for the past year.
Test Track had an average wait time today of 29 minutes. Its 7-day average is 71 minutes, so today ranks #6 for this week. Its 30-day average is 55 minutes, so today ranks #29 for the past month. Its 365-day average is 55 minutes, so today ranks #231 for the past year.
Frozen Ever After had an average wait time today of 23 minutes. Its 7-day average is 39 minutes, so today ranks #6 for this week. Its 30-day average is 29 minutes, so today ranks #15 for the past month. We received 4 actual wait times today, and the actual wait averaged 61% of the posted wait time, meaning the average actual wait was 14 minutes.
Disney’s Hollywood Studios Wait Times

Muppet*Vision 3D had an average wait time today of 36 minutes. Its 7-day average is 31 minutes, so today ranks #1 for this week. Its 30-day average is 27 minutes, so today ranks #1 for the past month. Its 365-day average is 18 minutes, so today ranks #5 for the past year.
Rock ‘n’ Roller Coaster Starring Daft Punk had an average wait time today of 39 minutes. Its 7-day average is 46 minutes, so today ranks #6 for this week. Its 30-day average is 37 minutes, so today ranks #12 for the past month. We received 9 actual wait times today, and the actual wait averaged 53% of the posted wait time, meaning the average actual wait was 21 minutes.
Star Tours: The Adventures Continue had an average wait time today of 39 minutes. Its 7-day average is 40 minutes, so today ranks #4 for this week. Its 30-day average is 33 minutes, so today ranks #5 for the past month. Its 365-day average is 26 minutes, so today ranks #24 for the past year. We received 9 actual wait times today, and the actual wait averaged 53% of the posted wait time.
The Twilight Zone Tower of Terror had an average wait time today of 61 minutes. Its 7-day average is 73 minutes, so today ranks #6 for this week. Its 30-day average is 57 minutes, so today ranks #12 for the past month. Its 365-day average is 51 minutes, so today ranks #56 for the past year. We received 7 actual wait times today, and the actual wait averaged 56% of the posted wait time.
Toy Story Mania! had an average wait time today of 37 minutes. Its 7-day average is 38 minutes, so today ranks #4 for this week. Its 30-day average is 30 minutes, so today ranks #7 for the past month. Its 365-day average is 28 minutes, so today ranks #39 for the past year. We received 22 actual wait times today, and the actual wait averaged 63% of the posted wait time.
Slinky Dog Dash had an average wait time today of 67 minutes. Its 7-day average is 73 minutes, so today ranks #4 for this week. Its 30-day average is 59 minutes, so today ranks #7 for the past month. Its 365-day average is 60 minutes, so today ranks #87 for the past year. We received 8 actual wait times today, and the actual wait averaged 67% of the posted wait time.
Mickey & Minnie’s Runaway Railway had an average wait time today of 52 minutes. Its 7-day average is 54 minutes, so today ranks #4 for this week. Its 30-day average is 45 minutes, so today ranks #6 for the past month. Its 365-day average is 60 minutes, so today ranks #131 for the past year. We received 9 actual wait times today, and the actual wait averaged 77% of the posted wait time.
Millennium Falcon: Smugglers Run had an average wait time today of 65 minutes. Its 7-day average is 66 minutes, so today ranks #4 for this week. Its 30-day average is 52 minutes, so today ranks #5 for the past month. Its 365-day average is 54 minutes, so today ranks #56 for the past year. We received 9 actual wait times today, and the actual wait averaged 66% of the posted wait time.
Rise of the Resistance has been having a pattern of a slight gap in Boarding Groups around 9:30 a.m. Today is no exception and the attraction is right on pace for the past 7 days.

Disney’s Animal Kingdom Wait Times

DINOSAUR had an average wait time today of 41 minutes. Its 7-day average is 49 minutes, so today ranks #5 for this week. Its 30-day average is 37 minutes, so today ranks #11 for the past month. Its 365-day average is 30 minutes, so today ranks #71 for the past year.
Expedition Everest – Legend of the Forbidden Mountain had an average wait time today of 10 minutes. Its 7-day average is 26 minutes, so today ranks #6 for this week. Its 30-day average is 20 minutes, so today ranks #22 for the past month. Its 365-day average is 29 minutes, so today ranks #226 for the past year. We received 11 actual wait times today, and the actual wait averaged 81% of the posted wait time.
Kilimanjaro Safaris had an average wait time today of 24 minutes. Its 7-day average is 31 minutes, so today ranks #5 for this week. Its 30-day average is 22 minutes, so today ranks #12 for the past month. We received 7 actual wait times today, and the actual wait averaged 55% of the posted wait time, meaning the average actual wait was 13 minutes.
It’s Tough to Be a Bug! had an average wait time today of 19 minutes. Its 7-day average is 27 minutes, so today ranks #4 for this week. Its 30-day average is 18 minutes, so today ranks #9 for the past month. Its 365-day average is 14 minutes, so today ranks #57 for the past year.
Na’vi River Journey had an average wait time today of 69 minutes. Its 7-day average is 74 minutes, so today ranks #4 for this week. Its 30-day average is 54 minutes, so today ranks #7 for the past month. Its 365-day average is 46 minutes, so today ranks #36 for the past year.
Avatar Flight of Passage had an average wait time today of 45 minutes. Its 7-day average is 62 minutes, so today ranks #5 for this week. Its 30-day average is 44 minutes, so today ranks #12 for the past month. We received 11 actual wait times today, and the actual wait averaged 71% of the posted wait time.

The post A Return to Normalcy – Disney World Wait Times for Tuesday, February 23, 2021 appeared first on TouringPlans.com Blog.