
Lots of great Halloween costumes all around the Magic Kingdom today. My sister Christina made us custom t-shirts depicting the suns in different scenes of It’s a Small World. That was our first ride of the day, too, and the CMs seem to enjoy the effort.
Mask compliance: We checked 500 guests in Tomorrowland today, just outside of Cosmic Ray’s exit near the Tomorrowland Speedway. 96% (481 of 500) were wearing masks as per Disney’s guidelines. We also checked 100 guests at Disney Springs yesterday, with 99 out of 100 wearing their masks properly. Let’s do the other numbers.
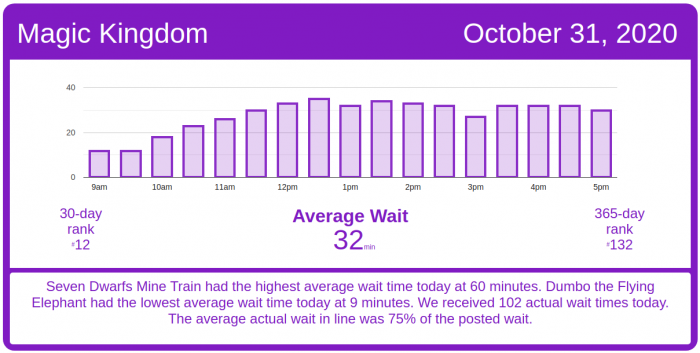
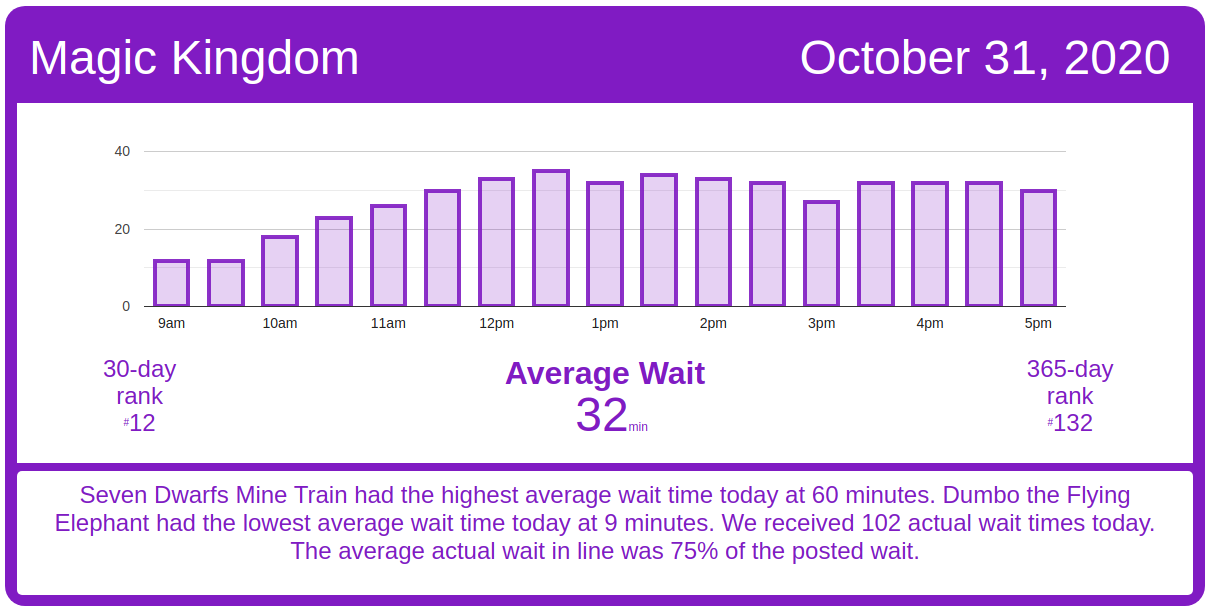
Magic Kingdom
No surprise that everyone wanted to ride Haunted Mansion today. Mansion’s average wait time was 55 minutes, well above its 7-day average of 37 minutes, so today ranks #1 for this week. Its 30-day average is 44 minutes, so today ranks #2 for the past month. Its 365-day average is 45 minutes, so today ranks #76 for the past year. We received 13 actual wait times today from Doombuggy enthusiasts, and their actual wait averaged 82% of the posted wait time.
The water cannons were off at Splash Mountain this morning, probably because of the cooler weather. Splash had an average posted wait time today of 55 minutes. We received 11 actual wait times today for Splash, and the actual wait averaged 115% of the posted wait time. Its 7-day average is 45 minutes, so today ranks #1 for this week. Its 30-day average is 62 minutes, so today ranks #17 for the past month.
Posted waits were more accurate over at Big Thunder Mountain Railroad, which had an average wait time today of 39 minutes. Its 7-day average is 37 minutes, so today ranks #3 for this week. Its 30-day average is 44 minutes, so today ranks #19 for the past month. We received 10 actual wait times today at Thunder, and the actual wait averaged 57% of the posted wait time.
Over in Fantasyland, Seven Dwarfs Mine Train had an average wait time today of 60 minutes. Its 7-day average is 47 minutes, so today ranks #1 for this week. Its 30-day average is 60 minutes, so today ranks #15 for the past month. And Peter Pan’s Flight had an average wait time of 33 minutes. Its 7-day average is 27 minutes, so today ranks #1 for this week. Its 30-day average is 34 minutes, meaning today ranks #16 for the past month. We received 6 actual wait times today from Pan, and the actual wait averaged 77% of the posted wait time.
If you’ve got to visit during a busy weekend, have a special tool at your side. Subscribe today and get our Lines app too.

The Barnstormer had an average wait time today of 18 minutes. Its 7-day average is 12 minutes, so today ranks #1 for this week. Its 30-day average is 18 minutes, so today ranks #12 for the past month. We received 4 actual wait times today from Barnstormer, and the actual wait averaged 61% of the posted wait time. And Dumbo the Flying Elephant had an average wait time today of 9 minutes. Its 7-day average is 8 minutes, so today ranks #1 for this week. Its 30-day average is 12 minutes, so today ranks #22 for the past month.
The Many Adventures of Winnie the Pooh had an average wait time today of 26 minutes. Its 7-day average is 20 minutes, so today ranks #1 for this week. Its 30-day average is 24 minutes, so today ranks #12 for the past month. We received 5 actual wait times today for Pooh, and the actual wait averaged 62% of the posted wait time.
Pirates of the Caribbean had some technical difficulties this afternoon. Pirates had an average wait time today of 47 minutes. Its 7-day average is 37 minutes, so today ranks #1 for this week. Its 30-day average is 47 minutes, so today ranks #18 for the past month. We received 7 actual wait times today, and the actual wait averaged 74% of the posted wait time.
Space Mountain had an average wait time today of 44 minutes. Its 7-day average is 27 minutes, so today ranks #1 for this week. Its 30-day average is 42 minutes, so today ranks #14 for the past month. We received 15 actual wait times at Space today (thank you, Liners!), and the actual wait averaged 67% of the posted wait time.
Animal Kingdom
Kilimanjaro Safaris had an average wait time today of 11 minutes! Good morning to go on safari. Its 7-day average is 19 minutes, so today ranks #6 for this week. Its 30-day average is 22 minutes, so today ranks #29 for the past month. And Expedition Everest had an average wait time today of 30 minutes, #1 for the week and #14 for the past month.
Kali River Rapids had an average wait time today of 23 minutes. Its 7-day average is 17 minutes, so today ranks #1 for this week. Its 30-day average is 23 minutes, and today ranks #13 for the past month.
Na’vi River Journey had an average wait time today of 40 minutes, 2 below its 7-day average – today ranks #3 for this week. Its 30-day average is 46 minutes, putting today in spot #23 for the past month.
Avatar Flight of Passage had an average wait time today of 45 minutes. Its 7-day average is 44 minutes, so today ranks #2 for this week. Its 30-day average is 63 minutes, so today ranks #24 for the past month. We received 6 actual wait times today for Flight of Passage, and the actual wait averaged 81% of the posted wait time.

Hollywood Studios
First thing to note is that the Studios is already prepping for Christmas:

A relatively light day for crowds over at the Studios. Rock ‘n’ Roller Coaster Starring Aerosmith had an average wait time today of 49 minutes. Its 7-day average is 45 minutes, so today ranks #2 for this week. Its 30-day average is 52 minutes, so today ranks #23 for the past month.
Star Tours: The Adventures Continue had an average wait time today of 28 minutes, which is enough time to watch half of the season premiere of The Mandalorian. Star Tours’ 7-day average is 26 minutes, so today ranks #2 for this week. Its 30-day average is 29 minutes, so today ranks #20 for the past month. We received 4 actual wait times at ST2 today, and the actual wait averaged 60% of the posted wait time.
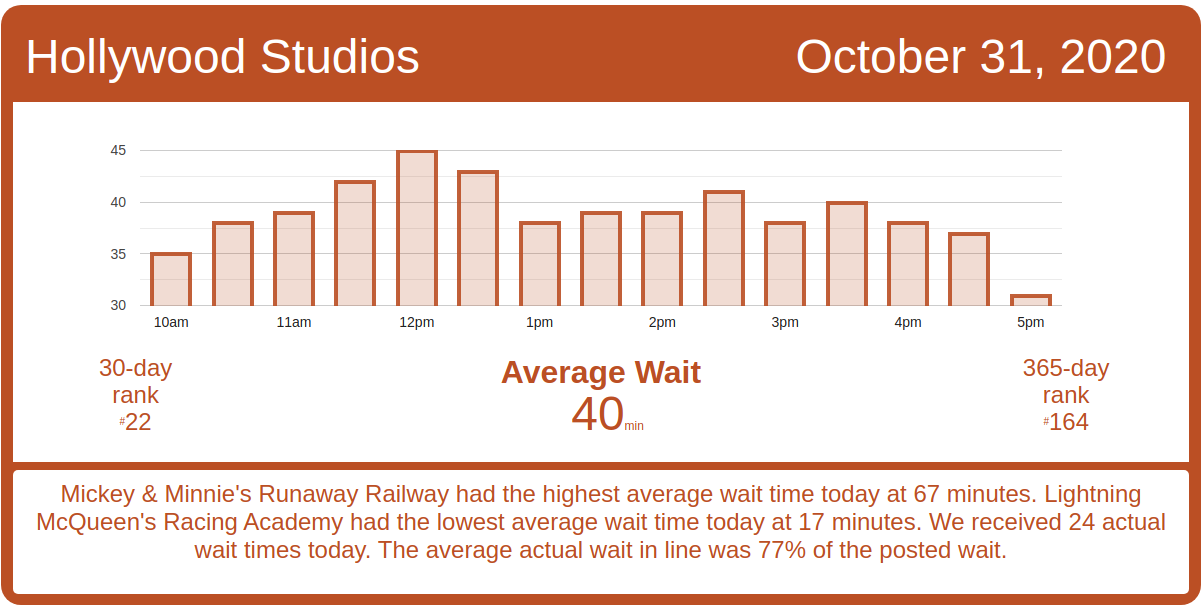
The Twilight Zone Tower of Terror had an average wait time today of 49 minutes. Its 7-day average is 41 minutes, so today ranks #1 for this week. Its 30-day average is 48 minutes, so today ranks #12 for the past month. Mickey & Minnie’s Runaway Railway had an average wait time today of 67 minutes. Its 7-day average is 72 minutes, so today ranks #4 for this week. Its 30-day average is 82 minutes, so today ranks #27 for the past month.
In Toy Story Land:
- Toy Story Mania! had an average wait time today of 26 minutes. Its 7-day average is 26 minutes, so today ranks #3 for this week. Its 30-day average is 30 minutes, so today ranks #26 for the past month. We received 8 actual wait times today for TSM, and the actual wait averaged 62% of the posted wait time.
- Slinky Dog Dash had an average wait time today of 62 minutes. Its 7-day average is 59 minutes, so today ranks #3 for this week. Its 30-day average is 68 minutes, so today ranks #25 for the past month.
- And Alien Swirling Saucers had an average wait time today of 28 minutes. Its 7-day average is 20 minutes, so today ranks #1 for this week. Its 30-day average is 25 minutes, so today ranks #8 for the past month.
Rise of the Resistance started off strong this morning and ran well for the first hour. Rise has had three significant delays in adding new boarding groups today: one for around 40 minutes at 11:10 a.m.; another for about 40 minutes just before 1 p.m., and almost an hour of delay right before 4 p.m.

Finally, Millennium Falcon: Smugglers Run had an average wait time today of 51 minutes. Its 7-day average is 52 minutes, so today ranks #3 for this week. Its 30-day average is 59 minutes, so today ranks #26 for the past month.
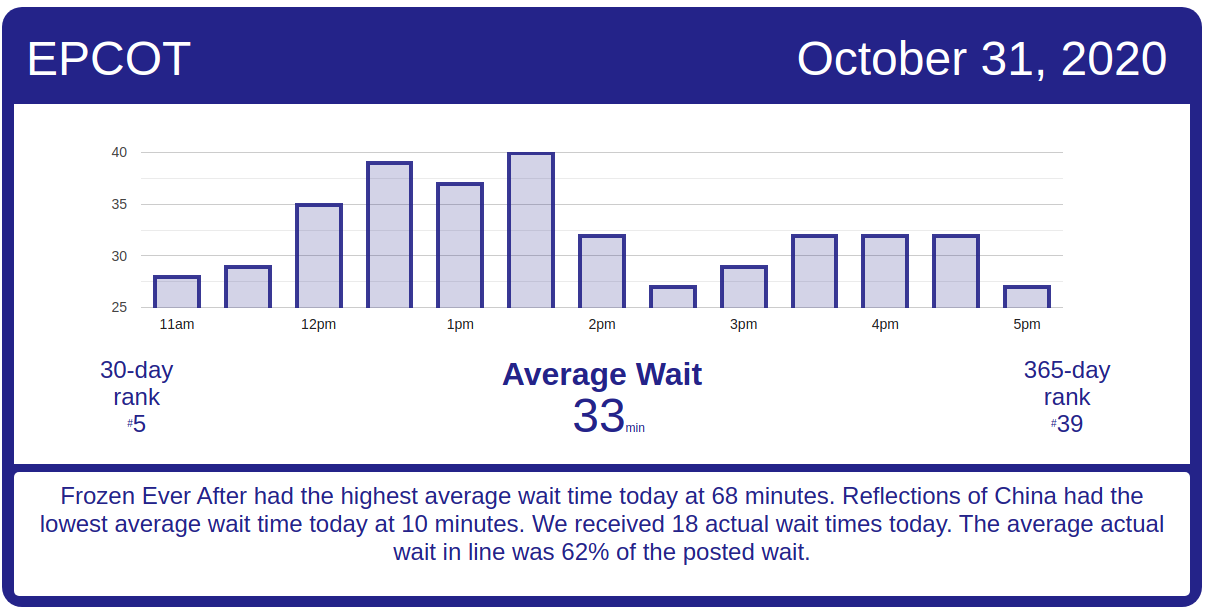
EPCOT
EPCOT was relatively busy today, but actual wait times weren’t as bad as the posted seemed. Spaceship Earth had an average wait time today of 28 minutes. Its 7-day average is 14 minutes, so today ranks #1 for this week. Its 30-day average is 19 minutes, so today ranks #4 for the past month. We received 4 actual wait times today for SSE, and the actual wait averaged 50% of the posted wait time.
Test Track had an average wait time today of 68 minutes. Its 7-day average is 49 minutes, so today ranks #1 for this week. Its 30-day average is 63 minutes, so today ranks #8 for the past month.
Soarin’ had an average wait time today of 43 minutes. Its 7-day average is 25 minutes, so today ranks #1 for this week. Its 30-day average is 36 minutes, so today ranks #9 for the past month. We received 4 actual wait times today, and the actual wait averaged 62% of the posted wait time.
Frozen Ever After had an average wait time today of 68 minutes. Its 7-day average is 52 minutes, so today ranks #1 for this week. Its 30-day average is 63 minutes, so today ranks #8 for the past month.
Mission: SPACE Orange had an average wait time today of 35 minutes. Its 7-day average is 18 minutes, so today ranks #1 for this week. Its 30-day average is 27 minutes, so today ranks #6 for the past month. And Mission: SPACE Green was much less busy – it had an average wait time today of 15 minutes. Its 7-day average is 10 minutes, so today ranks #1 for this week. Its 30-day average is 14 minutes, so today ranks #8 for the past month.
The post This is Halloween! – Walt Disney World Wait Times for Saturday, October 31, 2020 appeared first on TouringPlans.com Blog.