
Without any major holidays on the close horizon, now is a pretty good time to be in the Walt Disney World theme parks. Each park had its lowest posted wait times of the past month, with the slight exception being EPCOT. We received 216 actual wait times through our Lines app from our wonderful Liners today. Disney’s posted wait times were most accurate at Disney’s Hollywood Studios, and the least accurate at EPCOT which is typical. Let’s do the rest of the numbers!
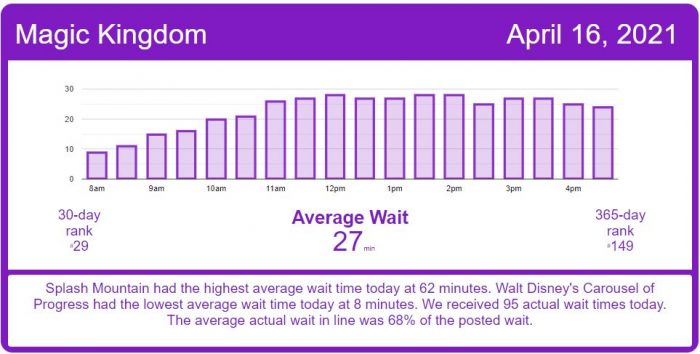
Magic Kingdom Wait Times

Big Thunder Mountain Railroad had an average wait time today of 30 minutes. Its 7-day average is 35 minutes, so today ranks #5 for this week. Its 30-day average is 40 minutes, so today ranks #27 for the past month. Its 365-day average is 43 minutes, so today ranks #229 for the past year. We received 18 actual wait times today, and the actual wait averaged 36% of the posted wait time.
Buzz Lightyear’s Space Ranger Spin had an average wait time today of 23 minutes. Its 7-day average is 40 minutes, so today ranks #6 for this week. Its 30-day average is 41 minutes, so today ranks #29 for the past month. Its 365-day average is 30 minutes, so today ranks #193 for the past year. We received 8 actual wait times today, and the actual wait averaged 70% of the posted wait time.
Jungle Cruise had an average wait time today of 39 minutes. Its 7-day average is 46 minutes, so today ranks #6 for this week. Its 30-day average is 49 minutes, so today ranks #29 for the past month. Its 365-day average is 40 minutes, so today ranks #169 for the past year.
Liberty Square Riverboat had an average wait time today of 20 minutes. Its 7-day average is -1 minutes, so today ranks #1 for this week. Its 30-day average is 5 minutes, so today ranks #1 for the past month. Its 365-day average is 5 minutes, so today ranks #1 for the past year.
Mad Tea Party had an average wait time today of 14 minutes. Its 7-day average is 16 minutes, so today ranks #5 for this week. Its 30-day average is 19 minutes, so today ranks #28 for the past month. Its 365-day average is 13 minutes, so today ranks #120 for the past year.
Pirates of the Caribbean had an average wait time today of 32 minutes. Its 7-day average is 38 minutes, so today ranks #6 for this week. Its 30-day average is 51 minutes, so today ranks #29 for the past month. Its 365-day average is 43 minutes, so today ranks #221 for the past year. We received 10 actual wait times today, and the actual wait averaged 88% of the posted wait time.
Tom Sawyer Island had an average wait time today of 34 minutes. Its 7-day average is 5 minutes, so today ranks #1 for this week. Its 30-day average is 5 minutes, so today ranks #1 for the past month. Its 365-day average is 5 minutes, so today ranks #1 for the past year.
Space Mountain had an average wait time today of 35 minutes. Its 7-day average is 37 minutes, so today ranks #5 for this week. Its 30-day average is 50 minutes, so today ranks #28 for the past month. Its 365-day average is 37 minutes, so today ranks #152 for the past year. We received 7 actual wait times today, and the actual wait averaged 64% of the posted wait time.
Splash Mountain had an average wait time today of 62 minutes. Its 7-day average is 65 minutes, so today ranks #5 for this week. Its 30-day average is 72 minutes, so today ranks #25 for the past month. Its 365-day average is 53 minutes, so today ranks #98 for the past year. We received 5 actual wait times today, and the actual wait averaged 79% of the posted wait time.
The Haunted Mansion had an average wait time today of 22 minutes. Its 7-day average is 25 minutes, so today ranks #4 for this week. Its 30-day average is 26 minutes, so today ranks #24 for the past month. Its 365-day average is 28 minutes, so today ranks #190 for the past year. We received 8 actual wait times today, and the actual wait averaged 40% of the posted wait time.
The Many Adventures of Winnie the Pooh had an average wait time today of 23 minutes. Its 7-day average is 28 minutes, so today ranks #6 for this week. Its 30-day average is 29 minutes, so today ranks #28 for the past month. Its 365-day average is 24 minutes, so today ranks #152 for the past year.
Seven Dwarfs Mine Train had an average wait time today of 47 minutes. Its 7-day average is 51 minutes, so today ranks #6 for this week. Its 30-day average is 61 minutes, so today ranks #30 for the past month. Its 365-day average is 57 minutes, so today ranks #198 for the past year. We received 8 actual wait times today, and the actual wait averaged 68% of the posted wait time.

EPCOT Wait Times

Gran Fiesta Tour Starring The Three Caballeros had an average wait time today of 7 minutes. Its 7-day average is 8 minutes, so today ranks #4 for this week. Its 30-day average is 8 minutes, so today ranks #16 for the past month. Its 365-day average is 9 minutes, so today ranks #167 for the past year.
Journey Into Imagination With Figment had an average wait time today of 17 minutes. Its 7-day average is 19 minutes, so today ranks #5 for this week. Its 30-day average is 19 minutes, so today ranks #22 for the past month. Its 365-day average is 14 minutes, so today ranks #89 for the past year. We received 4 actual wait times today, and the actual wait averaged 84% of the posted wait time.
Living with the Land had an average wait time today of 15 minutes. Its 7-day average is 12 minutes, so today ranks #1 for this week. Its 30-day average is 12 minutes, so today ranks #5 for the past month. Its 365-day average is 11 minutes, so today ranks #49 for the past year.
Mission: SPACE Orange had an average wait time today of 41 minutes. Its 7-day average is 44 minutes, so today ranks #3 for this week. Its 30-day average is 49 minutes, so today ranks #24 for the past month. Its 365-day average is 29 minutes, so today ranks #55 for the past year.
Soarin’ had an average wait time today of 50 minutes. Its 7-day average is 51 minutes, so today ranks #5 for this week. Its 30-day average is 61 minutes, so today ranks #30 for the past month. Its 365-day average is 36 minutes, so today ranks #79 for the past year.
Test Track had an average wait time today of 56 minutes. Its 7-day average is 53 minutes, so today ranks #1 for this week. Its 30-day average is 67 minutes, so today ranks #23 for the past month. Its 365-day average is 55 minutes, so today ranks #124 for the past year. We received 4 actual wait times today, and the actual wait averaged 69% of the posted wait time.
Frozen Ever After had an average wait time today of 39 minutes. Its 7-day average is 41 minutes, so today ranks #5 for this week. Its 30-day average is 50 minutes, so today ranks #27 for the past month. Its 365-day average is 46 minutes, so today ranks #156 for the past year.
Disney’s Hollywood Studios Wait Times

Rock ‘n’ Roller Coaster Starring Florence and the Machine had an average wait time today of 40 minutes. Its 7-day average is 35 minutes, so today ranks #1 for this week. Its 30-day average is 42 minutes, so today ranks #21 for the past month. We received 6 actual wait times today, and the actual wait averaged 94% of the posted wait time.
Star Tours: The Adventures Continue had an average wait time today of 28 minutes. Its 7-day average is 32 minutes, so today ranks #6 for this week. Its 30-day average is 34 minutes, so today ranks #29 for the past month. Its 365-day average is 28 minutes, so today ranks #147 for the past year. We received 7 actual wait times today, and the actual wait averaged 81% of the posted wait time.
The Twilight Zone Tower of Terror had an average wait time today of 60 minutes. Its 7-day average is 61 minutes, so today ranks #2 for this week. Its 30-day average is 65 minutes, so today ranks #16 for the past month. Its 365-day average is 52 minutes, so today ranks #80 for the past year.
Toy Story Mania! had an average wait time today of 30 minutes. Its 7-day average is 28 minutes, so today ranks #2 for this week. Its 30-day average is 32 minutes, so today ranks #22 for the past month. Its 365-day average is 27 minutes, so today ranks #106 for the past year. We received 13 actual wait times today, and the actual wait averaged 51% of the posted wait time.
Slinky Dog Dash had an average wait time today of 61 minutes. Its 7-day average is 63 minutes, so today ranks #3 for this week. Its 30-day average is 71 minutes, so today ranks #27 for the past month. Its 365-day average is 59 minutes, so today ranks #148 for the past year. We received 12 actual wait times today, and the actual wait averaged 60% of the posted wait time.
Mickey & Minnie’s Runaway Railway had an average wait time today of 41 minutes. Its 7-day average is 39 minutes, so today ranks #4 for this week. Its 30-day average is 39 minutes, so today ranks #13 for the past month. Its 365-day average is 55 minutes, so today ranks #233 for the past year. We received 13 actual wait times today, and the actual wait averaged 79% of the posted wait time.
Millennium Falcon: Smugglers Run had an average wait time today of 49 minutes. Its 7-day average is 53 minutes, so today ranks #5 for this week. Its 30-day average is 59 minutes, so today ranks #27 for the past month. Its 365-day average is 53 minutes, so today ranks #176 for the past year. We received 11 actual wait times today, and the actual wait averaged 88% of the posted wait time.

Things have gotten slightly better at Rise of the Resistance today, but it has still been bumpy. There’s been a few pauses in Boarding Groups being called, and it does not look like Boarding Groups in the 160 range above will be called tonight.
Disney’s Animal Kingdom Wait Times

DINOSAUR had an average wait time today of 39 minutes. Its 7-day average is 41 minutes, so today ranks #5 for this week. Its 30-day average is 47 minutes, so today ranks #28 for the past month. Its 365-day average is 32 minutes, so today ranks #113 for the past year.
Expedition Everest – Legend of the Forbidden Mountain had an average wait time today of 26 minutes. Its 7-day average is 19 minutes, so today ranks #1 for this week. Its 30-day average is 24 minutes, so today ranks #12 for the past month. Its 365-day average is 25 minutes, so today ranks #114 for the past year. We received 6 actual wait times today, and the actual wait averaged 42% of the posted wait time.
Kali River Rapids had an average wait time today of 23 minutes. Its 7-day average is 43 minutes, so today ranks #5 for this week. Its 30-day average is 43 minutes, so today ranks #12 for the past month. Its 365-day average is 20 minutes, so today ranks #55 for the past year.
Kilimanjaro Safaris had an average wait time today of 31 minutes. Its 7-day average is 44 minutes, so today ranks #5 for this week. Its 30-day average is 38 minutes, so today ranks #22 for the past month. Its 365-day average is 23 minutes, so today ranks #66 for the past year. We received 10 actual wait times today, and the actual wait averaged 51% of the posted wait time.
Na’vi River Journey had an average wait time today of 38 minutes. Its 7-day average is 39 minutes, so today ranks #4 for this week. Its 30-day average is 45 minutes, so today ranks #23 for the past month. Its 365-day average is 46 minutes, so today ranks #190 for the past year. We received 5 actual wait times today, and the actual wait averaged 48% of the posted wait time.
Avatar Flight of Passage had an average wait time today of 49 minutes. Its 7-day average is 61 minutes, so today ranks #6 for this week. Its 30-day average is 72 minutes, so today ranks #29 for the past month. Its 365-day average is 49 minutes, so today ranks #138 for the past year. We received 7 actual wait times today, and the actual wait averaged 83% of the posted wait time.
The post Lowest Wait Times of the Past Month – Disney World Wait Times for Friday, April 16, 2021 appeared first on TouringPlans.com Blog.