
The weather is lovely today and if you’ve checked tomorrow’s forecast for Orlando, it’s not looking so good. Couple that with it being Friday and you’ve got a sure thing that wait times would pick up a little today. Magic Kingdom’s average wait times rank at #9 out of the past 30 days. Animal Kingdom’s posted wait times ranked #15 of the past 30 days, while EPCOT and Hollywood Studios rank in their 20’s. At Disney’s Animal Kingdom today our team observed 488 out of 500 (96.7%) guests wearing their masks correctly. Let’s do the Friday night numbers!
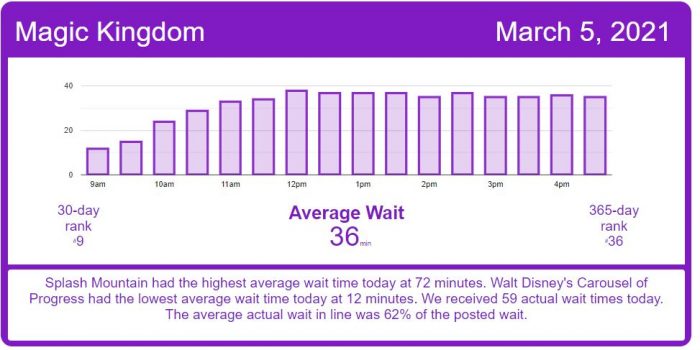
Magic Kingdom Wait Times

Big Thunder Mountain Railroad had an average wait time today of 35 minutes. Its 7-day average is 50 minutes, so today ranks #6 for this week. Its 30-day average is 52 minutes, so today ranks #27 for the past month. We received 16 actual wait times today, and the actual wait averaged 39% of the posted wait time, so the average actual wait was 17 minutes.
Buzz Lightyear’s Space Ranger Spin had an average wait time today of 41 minutes. Its 7-day average is 38 minutes, so today ranks #1 for this week. Its 30-day average is 39 minutes, so today ranks #13 for the past month. Its 365-day average is 29 minutes, so today ranks #43 for the past year.
Dumbo the Flying Elephant had an average wait time today of 22 minutes. Its 7-day average is 18 minutes, so today ranks #1 for this week. Its 30-day average is 19 minutes, so today ranks #10 for the past month. Its 365-day average is 13 minutes, so today ranks #31 for the past year.
Jungle Cruise had an average wait time today of 47 minutes. Its 7-day average is 40 minutes, so today ranks #1 for this week. Its 30-day average is 44 minutes, so today ranks #12 for the past month. Its 365-day average is 39 minutes, so today ranks #50 for the past year.
Mad Tea Party had an average wait time today of 25 minutes. Its 7-day average is -1 minutes, so today ranks #1 for this week. Its 30-day average is 17 minutes, so today ranks #1 for the past month. Its 365-day average is 13 minutes, so today ranks #4 for the past year.
Peter Pan’s Flight had an average wait time today of 46 minutes. Its 7-day average is 36 minutes, so today ranks #1 for this week. Its 30-day average is 38 minutes, so today ranks #4 for the past month. Its 365-day average is 33 minutes, so today ranks #25 for the past year.
Pirates of the Caribbean had an average wait time today of 59 minutes. Its 7-day average is 53 minutes, so today ranks #1 for this week. Its 30-day average is 53 minutes, so today ranks #11 for the past month. Its 365-day average is 42 minutes, so today ranks #22 for the past year.
Space Mountain had an average wait time today of 50 minutes. Its 7-day average is 38 minutes, so today ranks #1 for this week. Its 30-day average is 43 minutes, so today ranks #9 for the past month. Its 365-day average is 37 minutes, so today ranks #63 for the past year. We received 8 actual wait times today, and the actual wait averaged 54% of the posted wait time.
Splash Mountain had an average wait time today of 72 minutes. Its 7-day average is 61 minutes, so today ranks #1 for this week. Its 30-day average is 63 minutes, so today ranks #7 for the past month. Its 365-day average is 50 minutes, so today ranks #34 for the past year.
The Haunted Mansion had an average wait time today of 31 minutes. Its 7-day average is 24 minutes, so today ranks #1 for this week. Its 30-day average is 27 minutes, so today ranks #9 for the past month. Its 365-day average is 29 minutes, so today ranks #88 for the past year. We received 6 actual wait times today, and the actual wait averaged 57% of the posted wait time.
Seven Dwarfs Mine Train had an average wait time today of 59 minutes. Its 7-day average is 61 minutes, so today ranks #5 for this week. Its 30-day average is 69 minutes, so today ranks #23 for the past month. We received 9 actual wait times today, and the actual wait averaged 64% of the posted wait time, so the average actual wait was 38 minutes.
Under the Sea ~ Journey of the Little Mermaid had an average wait time today of 30 minutes. Its 7-day average is 24 minutes, so today ranks #1 for this week. Its 30-day average is 24 minutes, so today ranks #7 for the past month. Its 365-day average is 20 minutes, so today ranks #37 for the past year.
EPCOT Wait Times

Gran Fiesta Tour Starring The Three Caballeros had an average wait time today of 5 minutes. Its 7-day average is 9 minutes, so today ranks #6 for this week. Its 30-day average is 9 minutes, so today ranks #28 for the past month. Its 365-day average is 9 minutes, so today ranks #233 for the past year.
Journey Into Imagination With Figment had an average wait time today of 9 minutes. Its 7-day average is 12 minutes, so today ranks #4 for this week. Its 30-day average is 14 minutes, so today ranks #23 for the past month. Its 365-day average is 13 minutes, so today ranks #150 for the past year.
Soarin’ had an average wait time today of 34 minutes. Its 7-day average is 31 minutes, so today ranks #2 for this week. Its 30-day average is 37 minutes, so today ranks #13 for the past month. Its 365-day average is 32 minutes, so today ranks #97 for the past year.
Spaceship Earth had an average wait time today of 24 minutes. Its 7-day average is 17 minutes, so today ranks #1 for this week. Its 30-day average is 20 minutes, so today ranks #9 for the past month. Its 365-day average is 17 minutes, so today ranks #53 for the past year.
Test Track had an average wait time today of 38 minutes. Its 7-day average is 41 minutes, so today ranks #4 for this week. Its 30-day average is 54 minutes, so today ranks #26 for the past month. Its 365-day average is 54 minutes, so today ranks #188 for the past year. We received 4 actual wait times today, and the actual wait averaged 61% of the posted wait time.
The Seas with Nemo & Friends had an average wait time today of 9 minutes. Its 7-day average is 7 minutes, so today ranks #1 for this week. Its 30-day average is 9 minutes, so today ranks #15 for the past month. Its 365-day average is 11 minutes, so today ranks #136 for the past year.
Frozen Ever After had an average wait time today of 28 minutes. Its 7-day average is 26 minutes, so today ranks #4 for this week. Its 30-day average is 31 minutes, so today ranks #18 for the past month. Its 365-day average is 46 minutes, so today ranks #177 for the past year.
Disney’s Hollywood Studios Wait Times

Rock ‘n’ Roller Coaster Starring Aerosmith had an average wait time today of 39 minutes. Its 7-day average is 38 minutes, so today ranks #4 for this week. Its 30-day average is 41 minutes, so today ranks #20 for the past month. We received 7 actual wait times today, and the actual wait averaged 65% of the posted wait time, so the average actual wait was 25 minutes.
Star Tours: The Adventures Continue had an average wait time today of 32 minutes. Its 7-day average is 31 minutes, so today ranks #2 for this week. Its 30-day average is 35 minutes, so today ranks #21 for the past month. Its 365-day average is 27 minutes, so today ranks #72 for the past year. We received 5 actual wait times today, and the actual wait averaged 74% of the posted wait time.
The Twilight Zone Tower of Terror had an average wait time today of 61 minutes. Its 7-day average is 61 minutes, so today ranks #3 for this week. Its 30-day average is 62 minutes, so today ranks #17 for the past month. Its 365-day average is 50 minutes, so today ranks #57 for the past year. We received 6 actual wait times today, and the actual wait averaged 73% of the posted wait time.
Toy Story Mania! had an average wait time today of 33 minutes. Its 7-day average is 32 minutes, so today ranks #1 for this week. Its 30-day average is 33 minutes, so today ranks #13 for the past month. Its 365-day average is 27 minutes, so today ranks #49 for the past year. We received 12 actual wait times today, and the actual wait averaged 72% of the posted wait time.
Slinky Dog Dash had an average wait time today of 62 minutes. Its 7-day average is 60 minutes, so today ranks #1 for this week. Its 30-day average is 63 minutes, so today ranks #15 for the past month. Its 365-day average is 59 minutes, so today ranks #114 for the past year. We received 9 actual wait times today, and the actual wait averaged 69% of the posted wait time.
Mickey & Minnie’s Runaway Railway had an average wait time today of 43 minutes. Its 7-day average is 45 minutes, so today ranks #4 for this week. Its 30-day average is 47 minutes, so today ranks #22 for the past month. We received 4 actual wait times today, and the actual wait averaged 68% of the posted wait time.
Millennium Falcon: Smugglers Run had an average wait time today of 55 minutes. Its 7-day average is 58 minutes, so today ranks #4 for this week. Its 30-day average is 58 minutes, so today ranks #22 for the past month. Its 365-day average is 53 minutes, so today ranks #118 for the past year.
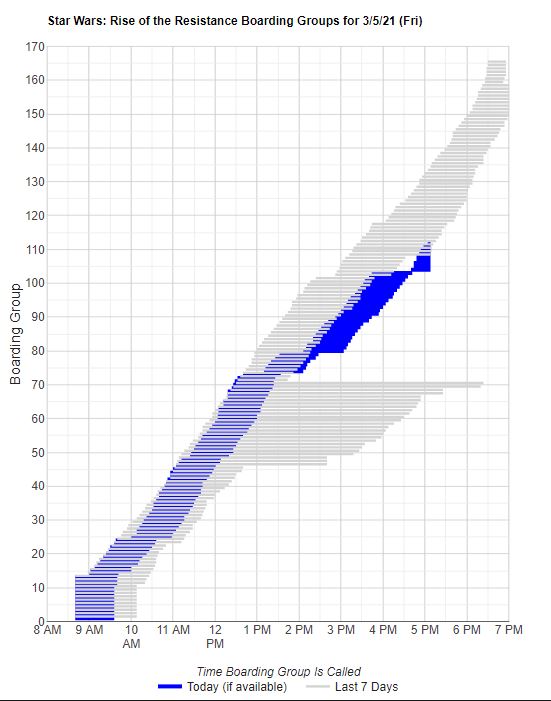
Star Wars: Rise of the Resistance had a choppy afternoon and may not reach the higher boarding groups like it has in the past few days.
Disney’s Animal Kingdom Wait Times

Let’s all welcome back everyone’s favorite anticlimactic river rapids ride, Kali River Rapids. A multi-month refurbishment has ended.
DINOSAUR had an average wait time today of 37 minutes. Its 7-day average is 36 minutes, so today ranks #3 for this week. Its 30-day average is 41 minutes, so today ranks #18 for the past month. Its 365-day average is 30 minutes, so today ranks #91 for the past year. We received 6 actual wait times today, and the actual wait averaged 95% of the posted wait time.
Expedition Everest – Legend of the Forbidden Mountain had an average wait time today of 13 minutes. Its 7-day average is 16 minutes, so today ranks #3 for this week. Its 30-day average is 20 minutes, so today ranks #19 for the past month. Its 365-day average is 27 minutes, so today ranks #203 for the past year. We received 10 actual wait times today, and the actual wait averaged 106% of the posted wait time.
Kali River Rapids had an average wait time today of 50 minutes. Its 7-day average is -1 minutes, so today ranks #1 for this week. Its 30-day average is -1 minutes, so today ranks #1 for the past month. Its 365-day average is 18 minutes, so today ranks #1 for the past year.
Kilimanjaro Safaris had an average wait time today of 17 minutes. Its 7-day average is 24 minutes, so today ranks #3 for this week. Its 30-day average is 27 minutes, so today ranks #20 for the past month. Its 365-day average is 23 minutes, so today ranks #136 for the past year. We received 10 actual wait times today, and the actual wait averaged 60% of the posted wait time.
Na’vi River Journey had an average wait time today of 63 minutes. Its 7-day average is 64 minutes, so today ranks #2 for this week. Its 30-day average is 64 minutes, so today ranks #15 for the past month. Its 365-day average is 45 minutes, so today ranks #44 for the past year.
Avatar Flight of Passage had an average wait time today of 47 minutes. Its 7-day average is 41 minutes, so today ranks #2 for this week. Its 30-day average is 51 minutes, so today ranks #16 for the past month. We received 6 actual wait times today, and the actual wait averaged 70% of the posted wait time, so the average actual wait was 33 minutes.
The post Nice Weather, Decent Crowds – Disney World Wait Times for Friday, March 5, 2021 appeared first on TouringPlans.com Blog.