Still Busy! Walt Disney World Wait Times for Wednesday, February 17, 2021

All four Walt Disney World parks continue to be busy this week.  Average posted wait times across property today all ranked in the top 5 for the past month.  We counted 482 of 500 guests (96%) at EPCOT wearing masks according to Disney’s guidelines.  And we got 143 actual wait times from our fabulous Lines community. Let’s do the rest of the numbers!

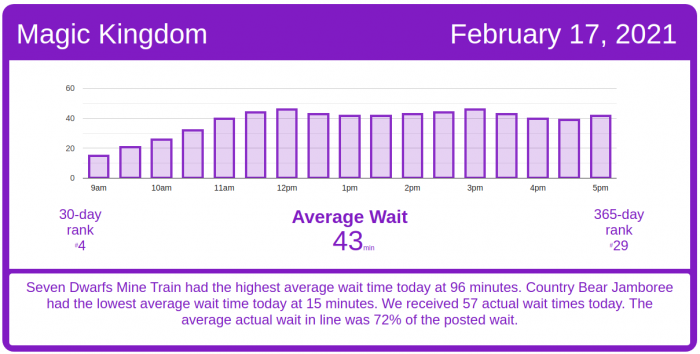
Magic Kingdom Wait Times

The Haunted Mansion had an average wait time today of 30 minutes. Its 7-day average is 33 minutes, so today ranks #3 for this week. Its 30-day average is 20 minutes, so today ranks #4 for the past month. Its 365-day average is 31 minutes, so today ranks #105 for the past year. We received 5 actual wait times today, and the actual wait averaged 52% of the posted wait time.

Seven Dwarfs Mine Train seems to have had a technical issue this morning – posted wait times went from 65 minutes at 9:10 a.m. to 120 minutes at 9:21 a.m.  That’s roughly the equivalent of around 1,000 people getting in line just for 7DMT in eleven minutes.  At 3 guests every six feet, that would’ve extended the existing line almost 0.4 miles in those 11 minutes.  That seems unlikely, so one of those two wait time numbers was probably off.

Magic Kingdom wait times for Wednesday, February 17, 2021
Astro Orbiter
Average Posted Wait
50
7-Day Rank
#1
30-Day Rank
#1
365-Day Rank
#2
Big Thunder Mountain Railroad
Average Posted Wait
59
Actual Waits Were
59%
7-Day Rank
#3
30-Day Rank
#3
365-Day Rank
#40
Buzz Lightyear’s Space Ranger Spin
Average Posted Wait
43
Actual Waits Were
88%
7-Day Rank
#5
30-Day Rank
#5
365-Day Rank
#46
Country Bear Jamboree
Average Posted Wait
15
7-Day Rank
#1
30-Day Rank
#1
365-Day Rank
#1
Dumbo the Flying Elephant
Average Posted Wait
22
7-Day Rank
#4
30-Day Rank
#5
365-Day Rank
#41
“it’s a small world”
Average Posted Wait
51
7-Day Rank
#2
30-Day Rank
#2
365-Day Rank
#9
Jungle Cruise
Average Posted Wait
45
Actual Waits Were
74%
7-Day Rank
#5
30-Day Rank
#8
365-Day Rank
#78
Mad Tea Party
Average Posted Wait
21
7-Day Rank
#2
30-Day Rank
#2
365-Day Rank
#28
Mickey’s PhilharMagic
Average Posted Wait
31
7-Day Rank
#2
30-Day Rank
#2
365-Day Rank
#22
Peter Pan’s Flight
Average Posted Wait
45
7-Day Rank
#3
30-Day Rank
#3
365-Day Rank
#46
Pirates of the Caribbean
Average Posted Wait
65
Actual Waits Were
64%
7-Day Rank
#2
30-Day Rank
#2
365-Day Rank
#4
Space Mountain
Average Posted Wait
63
7-Day Rank
#3
30-Day Rank
#3
365-Day Rank
#42
Splash Mountain
Average Posted Wait
66
7-Day Rank
#5
30-Day Rank
#5
365-Day Rank
#47
The Barnstormer
Average Posted Wait
33
7-Day Rank
#4
30-Day Rank
#4
365-Day Rank
#32
The Haunted Mansion
Average Posted Wait
30
Actual Waits Were
52%
7-Day Rank
#3
30-Day Rank
#4
365-Day Rank
#105
The Magic Carpets of Aladdin
Average Posted Wait
21
7-Day Rank
#4
30-Day Rank
#4
365-Day Rank
#35
The Many Adventures of Winnie the Pooh
Average Posted Wait
32
7-Day Rank
#4
30-Day Rank
#4
365-Day Rank
#40
Tomorrowland Speedway
Average Posted Wait
25
7-Day Rank
#4
30-Day Rank
#5
365-Day Rank
#44
Seven Dwarfs Mine Train
Average Posted Wait
96
Actual Waits Were
86%
7-Day Rank
#1
30-Day Rank
#1
365-Day Rank
#29
Under the Sea ~ Journey of the Little Mermaid
Average Posted Wait
28
Actual Waits Were
38%
7-Day Rank
#4
30-Day Rank
#4
365-Day Rank
#56

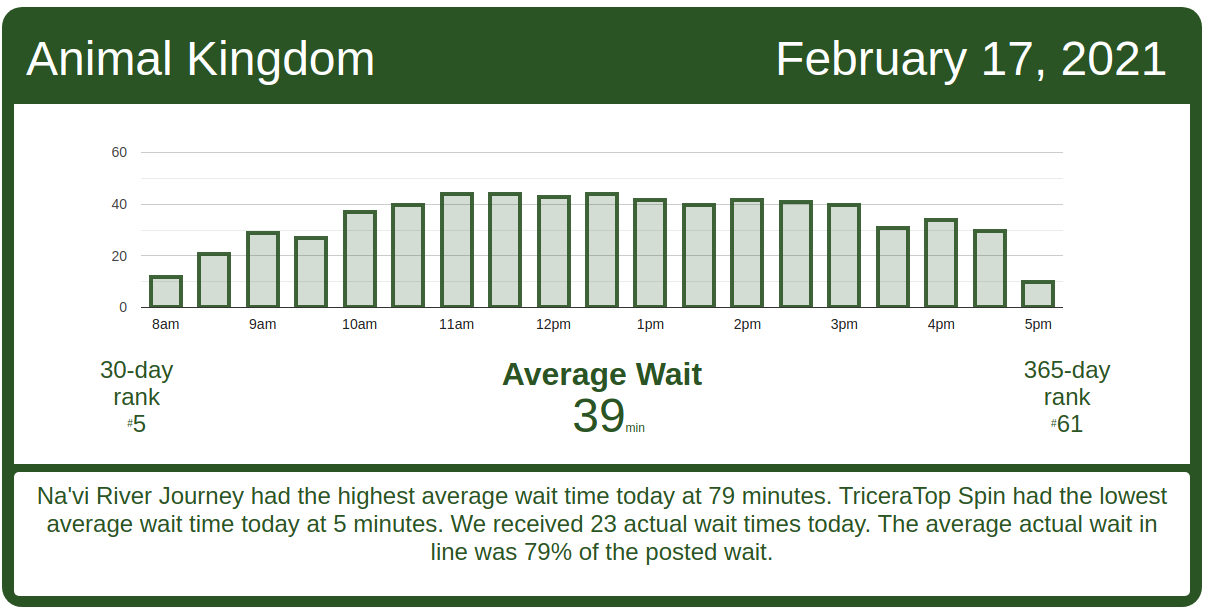
Animal Kingdom Wait Times

Expedition Everest had an average wait time today of 24 minutes. Its 7-day average is 32 minutes, so today ranks #4 for this week. Its 30-day average is 17 minutes, so today ranks #6 for the past month. Its 365-day average is 31 minutes, so today ranks #130 for the past year. We received 6 actual wait times today, and the actual wait averaged 108% of the posted wait time.  That’s unusual.

Animal Kingdom wait times for Wednesday, February 17, 2021
DINOSAUR
Average Posted Wait
51
7-Day Rank
#3
30-Day Rank
#3
365-Day Rank
#39
Expedition Everest – Legend of the Forbidden Mountain
Average Posted Wait
24
Actual Waits Were
108%
7-Day Rank
#4
30-Day Rank
#6
365-Day Rank
#130
Kilimanjaro Safaris
Average Posted Wait
31
Actual Waits Were
39%
7-Day Rank
#4
30-Day Rank
#4
365-Day Rank
#57
It’s Tough to Be a Bug!
Average Posted Wait
29
7-Day Rank
#2
30-Day Rank
#2
365-Day Rank
#14
TriceraTop Spin
Average Posted Wait
5
7-Day Rank
#4
30-Day Rank
#5
365-Day Rank
#72
Expedition Everest Single Rider Line
Average Posted Wait
10
7-Day Rank
#1
30-Day Rank
#1
365-Day Rank
#1
Na’vi River Journey
Average Posted Wait
79
7-Day Rank
#1
30-Day Rank
#1
365-Day Rank
#25
Avatar Flight of Passage
Average Posted Wait
58
Actual Waits Were
89%
7-Day Rank
#4
30-Day Rank
#4
365-Day Rank
#98

Hollywood Studios Wait Times

The Twilight Zone Tower of Terror had an average wait time today of 94 minutes. Its 7-day average is 64 minutes, so today ranks #1 for this week. That high of a wait time today indicates a technical problem with the ride. We received 4 actual wait times today, and the actual wait averaged 86% of the posted wait time.

Hollywood Studios wait times for Wednesday, February 17, 2021

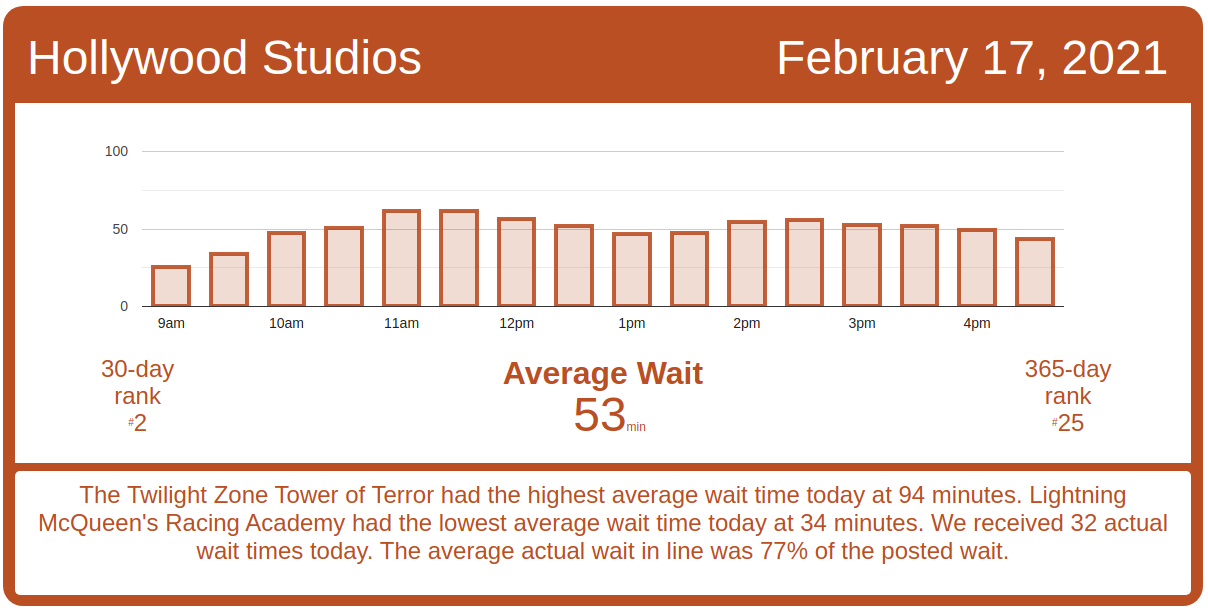
Rise of the Resistance has had a fairly normal day of operations today. The first set of 13 boarding groups was called around 8:40 a.m., but there was a delay of around 40 minutes – until around 9:20 a.m. – for boarding group 14 and beyond to get called.  Rise of the Resistance ran smoothly after that until around 3:30 p.m., when boarding paused for around 40 minutes around group 115.  At its current rate, ROTR should approach boarding group 160 before the day ends.
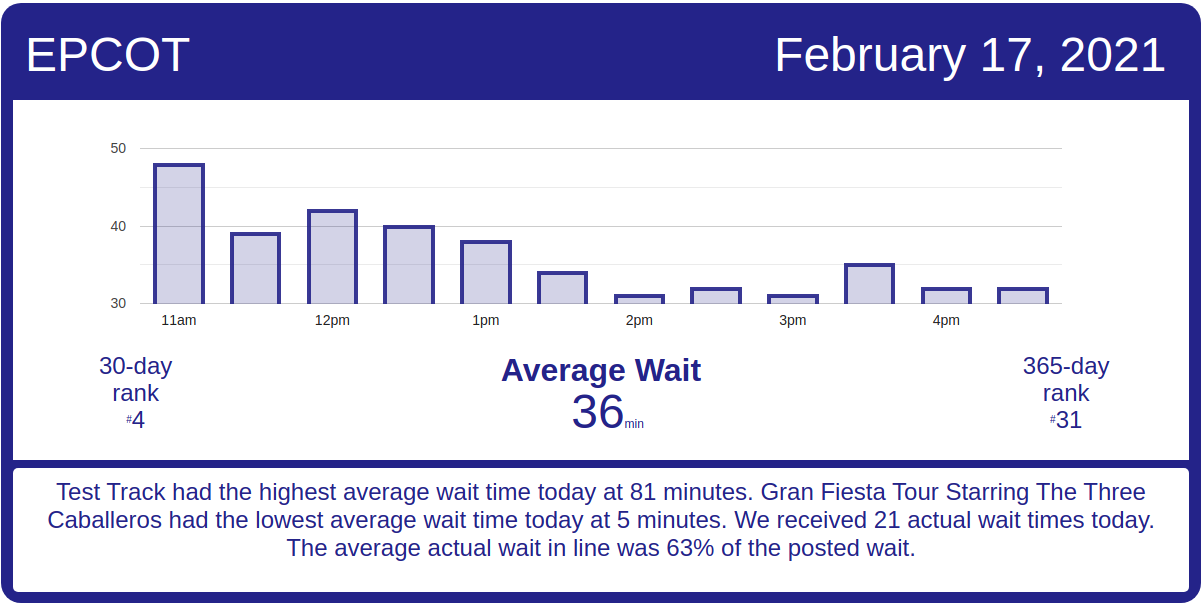
Rise of the Resistance boarding groups for Wednesday, February 17, 2021
Muppet*Vision 3D
Average Posted Wait
38
7-Day Rank
#1
30-Day Rank
#1
365-Day Rank
#1
Rock ‘n’ Roller Coaster Starring Aerosmith
Average Posted Wait
47
7-Day Rank
#5
30-Day Rank
#5
365-Day Rank
#116
Star Tours: The Adventures Continue
Average Posted Wait
41
7-Day Rank
#1
30-Day Rank
#1
365-Day Rank
#13
The Twilight Zone Tower of Terror
Average Posted Wait
94
Actual Waits Were
86%
7-Day Rank
#1
30-Day Rank
#1
365-Day Rank
#10
Toy Story Mania!
Average Posted Wait
37
Actual Waits Were
67%
7-Day Rank
#2
30-Day Rank
#2
365-Day Rank
#37
Slinky Dog Dash
Average Posted Wait
75
Actual Waits Were
71%
7-Day Rank
#1
30-Day Rank
#1
365-Day Rank
#42
Alien Swirling Saucers
Average Posted Wait
40
7-Day Rank
#1
30-Day Rank
#1
365-Day Rank
#15
Mickey & Minnie’s Runaway Railway
Average Posted Wait
51
Actual Waits Were
93%
7-Day Rank
#3
30-Day Rank
#3
365-Day Rank
#134
Millennium Falcon: Smugglers Run
Average Posted Wait
73
7-Day Rank
#1
30-Day Rank
#1
365-Day Rank
#34

EPCOT Wait Times

Actual wait times at EPCOT today were barely 60% of the posted waits, far lower than the other parks. As an example, Spaceship Earth had an average posted wait time today of 32 minutes. Its 7-day average is 27 minutes, so today ranks #3 for this week. Its 30-day average is 16 minutes, so today ranks #3 for the past month. Its 365-day average is 17 minutes, so today ranks #16 for the past year. We received 6 actual wait times today, and the actual wait averaged 36% of the posted wait time.

EPCOT wait times for Wednesday, February 17, 2021
Gran Fiesta Tour Starring The Three Caballeros
Average Posted Wait
5
7-Day Rank
#6
30-Day Rank
#23
365-Day Rank
#216
Journey Into Imagination With Figment
Average Posted Wait
23
7-Day Rank
#3
30-Day Rank
#4
365-Day Rank
#36
Living with the Land
Average Posted Wait
16
7-Day Rank
#1
30-Day Rank
#1
365-Day Rank
#34
Mission: SPACE Orange
Average Posted Wait
39
7-Day Rank
#2
30-Day Rank
#2
365-Day Rank
#39
Soarin’
Average Posted Wait
63
7-Day Rank
#2
30-Day Rank
#2
365-Day Rank
#14
Spaceship Earth
Average Posted Wait
32
Actual Waits Were
38%
7-Day Rank
#3
30-Day Rank
#3
365-Day Rank
#16
Test Track
Average Posted Wait
81
7-Day Rank
#2
30-Day Rank
#2
365-Day Rank
#19
The Seas with Nemo & Friends
Average Posted Wait
15
7-Day Rank
#3
30-Day Rank
#3
365-Day Rank
#55
Frozen Ever After
Average Posted Wait
45
7-Day Rank
#3
30-Day Rank
#3
365-Day Rank
#123

The post Still Busy! Walt Disney World Wait Times for Wednesday, February 17, 2021 appeared first on TouringPlans.com Blog.