More “Top 10” Days – Disney World Wait Times for Saturday, February 27, 2021

Posted wait times at the Magic Kingdom, EPCOT, and Animal Kingdom were all in the top 10 of the past month today, with much warmer weather predicted for this weekend.  We had three researchers in the Animal Kingdom this morning, testing different touring plans, and that went really well, too.

We counted 497 of 500 guests (99%) wearing masks in the Animal Kingdom today according to Disney’s guidelines.  And we’ve already got 202 actual wait times from our fabulous Lines community! Let’s do the rest of the numbers!

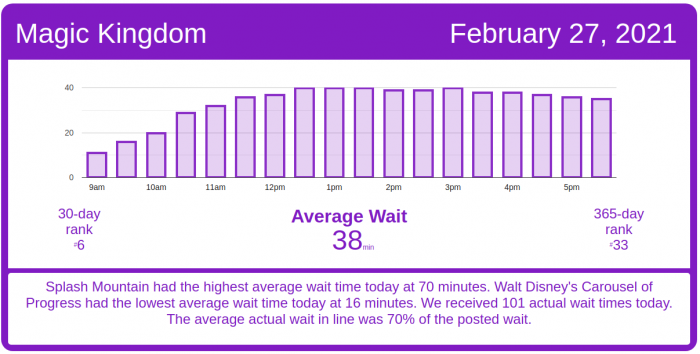
Magic Kingdom Wait Times

The Haunted Mansion had an average wait time today of 31 minutes. Its 7-day average is 28 minutes, so today ranks #2 for this week. Its 30-day average is 25 minutes, so today ranks #9 for the past month. Its 365-day average is 29 minutes, so today ranks #90 for the past year. We received 25(!) actual wait times today, and the actual wait averaged 48% of the posted wait time.

Magic Kingdom wait times for Saturday, February 27, 2021
Astro Orbiter
Average Posted Wait
43
7-Day Rank
#2
30-Day Rank
#10
365-Day Rank
#23
Big Thunder Mountain Railroad
Average Posted Wait
51
Actual Waits Were
63%
7-Day Rank
#4
30-Day Rank
#16
365-Day Rank
#83
Buzz Lightyear’s Space Ranger Spin
Average Posted Wait
44
Actual Waits Were
55%
7-Day Rank
#2
30-Day Rank
#10
365-Day Rank
#33
Prince Charming Regal Carrousel
Average Posted Wait
48
7-Day Rank
#1
30-Day Rank
#1
365-Day Rank
#1
Country Bear Jamboree
Average Posted Wait
21
7-Day Rank
#1
30-Day Rank
#1
365-Day Rank
#1
Dumbo the Flying Elephant
Average Posted Wait
23
7-Day Rank
#2
30-Day Rank
#7
365-Day Rank
#28
“it’s a small world”
Average Posted Wait
46
7-Day Rank
#3
30-Day Rank
#12
365-Day Rank
#33
Jungle Cruise
Average Posted Wait
43
Actual Waits Were
66%
7-Day Rank
#4
30-Day Rank
#17
365-Day Rank
#95
Mickey’s PhilharMagic
Average Posted Wait
33
7-Day Rank
#1
30-Day Rank
#1
365-Day Rank
#7
Peter Pan’s Flight
Average Posted Wait
45
Actual Waits Were
109%
7-Day Rank
#1
30-Day Rank
#6
365-Day Rank
#39
Pirates of the Caribbean
Average Posted Wait
61
Actual Waits Were
81%
7-Day Rank
#1
30-Day Rank
#6
365-Day Rank
#15
Tom Sawyer Island
Average Posted Wait
30
7-Day Rank
#1
30-Day Rank
#1
365-Day Rank
#1
Space Mountain
Average Posted Wait
50
Actual Waits Were
74%
7-Day Rank
#1
30-Day Rank
#9
365-Day Rank
#69
Splash Mountain
Average Posted Wait
70
Actual Waits Were
71%
7-Day Rank
#1
30-Day Rank
#7
365-Day Rank
#44
The Barnstormer
Average Posted Wait
29
7-Day Rank
#4
30-Day Rank
#13
365-Day Rank
#49
The Haunted Mansion
Average Posted Wait
31
Actual Waits Were
48%
7-Day Rank
#2
30-Day Rank
#9
365-Day Rank
#90
The Magic Carpets of Aladdin
Average Posted Wait
18
7-Day Rank
#4
30-Day Rank
#14
365-Day Rank
#40
The Many Adventures of Winnie the Pooh
Average Posted Wait
32
7-Day Rank
#2
30-Day Rank
#7
365-Day Rank
#37
Tomorrowland Speedway
Average Posted Wait
19
7-Day Rank
#2
30-Day Rank
#12
365-Day Rank
#79
Walt Disney’s Carousel of Progress
Average Posted Wait
16
7-Day Rank
#1
30-Day Rank
#1
365-Day Rank
#1
Seven Dwarfs Mine Train
Average Posted Wait
66
Actual Waits Were
86%
7-Day Rank
#4
30-Day Rank
#14
365-Day Rank
#91
Under the Sea ~ Journey of the Little Mermaid
Average Posted Wait
31
7-Day Rank
#2
30-Day Rank
#5
365-Day Rank
#35

Animal Kingdom Wait Times

Expedition Everest – Legend of the Forbidden Mountain had an average wait time today of 27 minutes. Its 7-day average is 20 minutes, so today ranks #1 for this week. Its 30-day average is 20 minutes, so today ranks #7 for the past month. Its 365-day average is 28 minutes, so today ranks #105 for the past year. We received 17 actual wait times today, and the actual wait averaged 68% of the posted wait time.

Animal Kingdom wait times for Saturday, February 27, 2021
DINOSAUR
Average Posted Wait
52
Actual Waits Were
130%
7-Day Rank
#1
30-Day Rank
#6
365-Day Rank
#34
Expedition Everest – Legend of the Forbidden Mountain
Average Posted Wait
27
Actual Waits Were
68%
7-Day Rank
#1
30-Day Rank
#7
365-Day Rank
#105
Kilimanjaro Safaris
Average Posted Wait
37
Actual Waits Were
47%
7-Day Rank
#1
30-Day Rank
#5
365-Day Rank
#29
It’s Tough to Be a Bug!
Average Posted Wait
34
7-Day Rank
#1
30-Day Rank
#1
365-Day Rank
#4
TriceraTop Spin
Average Posted Wait
16
7-Day Rank
#1
30-Day Rank
#1
365-Day Rank
#1
Na’vi River Journey
Average Posted Wait
94
Actual Waits Were
83%
7-Day Rank
#1
30-Day Rank
#1
365-Day Rank
#3
Avatar Flight of Passage
Average Posted Wait
65
Actual Waits Were
66%
7-Day Rank
#1
30-Day Rank
#7
365-Day Rank
#74

Hollywood Studios Wait Times

Mickey & Minnie’s Runaway Railway had an average wait time today of 44 minutes. Its 7-day average is 51 minutes, so today ranks #6 for this week. Its 30-day average is 46 minutes, so today ranks #18 for the past month. Its 365-day average is 60 minutes, so today ranks #193 for the past year. We received 13 actual wait times today, and the actual wait averaged 71% of the posted wait time.

Hollywood Studios wait times for Saturday, February 27, 2021
Muppet*Vision 3D
Average Posted Wait
30
7-Day Rank
#5
30-Day Rank
#12
365-Day Rank
#33
Rock ‘n’ Roller Coaster Starring Aerosmith
Average Posted Wait
42
7-Day Rank
#2
30-Day Rank
#12
365-Day Rank
#130
Star Tours: The Adventures Continue
Average Posted Wait
33
Actual Waits Were
81%
7-Day Rank
#6
30-Day Rank
#20
365-Day Rank
#65
The Twilight Zone Tower of Terror
Average Posted Wait
57
7-Day Rank
#6
30-Day Rank
#17
365-Day Rank
#66
Toy Story Mania!
Average Posted Wait
31
Actual Waits Were
65%
7-Day Rank
#6
30-Day Rank
#15
365-Day Rank
#65
Walt Disney Presents
Average Posted Wait
31
7-Day Rank
#1
30-Day Rank
#1
365-Day Rank
#1
Slinky Dog Dash
Average Posted Wait
60
Actual Waits Were
67%
7-Day Rank
#5
30-Day Rank
#15
365-Day Rank
#124
Alien Swirling Saucers
Average Posted Wait
26
7-Day Rank
#6
30-Day Rank
#20
365-Day Rank
#91
Mickey & Minnie’s Runaway Railway
Average Posted Wait
44
Actual Waits Were
71%
7-Day Rank
#6
30-Day Rank
#18
365-Day Rank
#193
Millennium Falcon: Smugglers Run
Average Posted Wait
56
Actual Waits Were
81%
7-Day Rank
#6
30-Day Rank
#18
365-Day Rank
#109
Star Wars: Rise of the Resistance
Average Posted Wait
75
7-Day Rank
#1
30-Day Rank
#1
365-Day Rank
#19

EPCOT Wait Times

Soarin’ had an average wait time today of 42 minutes. Its 7-day average is 38 minutes, so today ranks #1 for this week. Its 30-day average is 35 minutes, so today ranks #9 for the past month. Its 365-day average is 32 minutes, so today ranks #68 for the past year. We received 5 actual wait times today, and the actual wait averaged 90% of the posted wait time.

EPCOT wait times for Saturday, February 27, 2021
Gran Fiesta Tour Starring The Three Caballeros
Average Posted Wait
15
7-Day Rank
#1
30-Day Rank
#2
365-Day Rank
#21
Journey Into Imagination With Figment
Average Posted Wait
15
7-Day Rank
#2
30-Day Rank
#11
365-Day Rank
#81
Living with the Land
Average Posted Wait
10
7-Day Rank
#1
30-Day Rank
#7
365-Day Rank
#139
Mission: SPACE Orange
Average Posted Wait
36
7-Day Rank
#1
30-Day Rank
#7
365-Day Rank
#51
Soarin’
Average Posted Wait
42
Actual Waits Were
90%
7-Day Rank
#1
30-Day Rank
#9
365-Day Rank
#68
Spaceship Earth
Average Posted Wait
27
7-Day Rank
#1
30-Day Rank
#7
365-Day Rank
#40
Test Track
Average Posted Wait
54
7-Day Rank
#1
30-Day Rank
#11
365-Day Rank
#113
The Seas with Nemo & Friends
Average Posted Wait
13
7-Day Rank
#1
30-Day Rank
#7
365-Day Rank
#72
Frozen Ever After
Average Posted Wait
33
7-Day Rank
#2
30-Day Rank
#11
365-Day Rank
#158

The post More “Top 10” Days – Disney World Wait Times for Saturday, February 27, 2021 appeared first on TouringPlans.com Blog.