Moderate Crowds End The Month – Disney World Wait Times for Sunday, February 28, 2021

The last day of February saw moderate crowds at all four Walt Disney World parks, as warmer temperatures continued throughout Central Florida.  Posted wait times today were anywhere from the 20th- to the 10th-highest over the last 30 days.  And even with that, EPCOT’s posted wait times look like they were overstated when we compare them to the actual wait times in line we got.

We counted 487 of 500 guests (97%) at Magic Kingdom today wearing masks according to Disney’s guidelines.  And we’ve received 181 actual wait times so far today from our fabulous Lines community!  Let’s do the rest of the numbers!

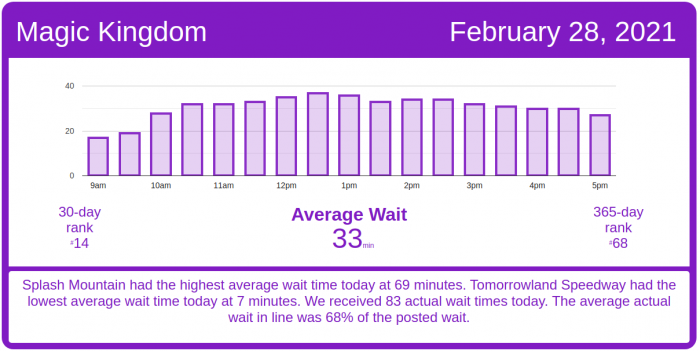
Magic Kingdom Wait Times

You know it’s warm when we get more actual wait times for Splash Mountain than any other attraction in the Magic Kingdom.  Splash had an average wait time today of 69 minutes. Its 7-day average is 68 minutes, so today ranks #4 for this week. Its 30-day average is 58 minutes, so today ranks #10 for the past month. We received 11 actual wait times today, and the actual wait averaged 68% of the posted wait time.

Magic Kingdom wait times for Sunday, February 28, 2021
Astro Orbiter
Average Posted Wait
33
7-Day Rank
#6
30-Day Rank
#24
365-Day Rank
#109
Big Thunder Mountain Railroad
Average Posted Wait
41
Actual Waits Were
68%
7-Day Rank
#6
30-Day Rank
#20
365-Day Rank
#143
Buzz Lightyear’s Space Ranger Spin
Average Posted Wait
39
Actual Waits Were
57%
7-Day Rank
#4
30-Day Rank
#16
365-Day Rank
#66
Prince Charming Regal Carrousel
Average Posted Wait
39
7-Day Rank
#1
30-Day Rank
#1
365-Day Rank
#1
Dumbo the Flying Elephant
Average Posted Wait
16
7-Day Rank
#5
30-Day Rank
#18
365-Day Rank
#75
“it’s a small world”
Average Posted Wait
40
7-Day Rank
#6
30-Day Rank
#19
365-Day Rank
#84
Jungle Cruise
Average Posted Wait
40
Actual Waits Were
90%
7-Day Rank
#5
30-Day Rank
#20
365-Day Rank
#131
Mickey’s PhilharMagic
Average Posted Wait
29
7-Day Rank
#3
30-Day Rank
#11
365-Day Rank
#39
Peter Pan’s Flight
Average Posted Wait
39
Actual Waits Were
65%
7-Day Rank
#3
30-Day Rank
#13
365-Day Rank
#75
Pirates of the Caribbean
Average Posted Wait
55
Actual Waits Were
73%
7-Day Rank
#4
30-Day Rank
#13
365-Day Rank
#41
Tom Sawyer Island
Average Posted Wait
20
7-Day Rank
#1
30-Day Rank
#1
365-Day Rank
#1
Space Mountain
Average Posted Wait
40
Actual Waits Were
60%
7-Day Rank
#4
30-Day Rank
#15
365-Day Rank
#109
Splash Mountain
Average Posted Wait
69
Actual Waits Were
68%
7-Day Rank
#4
30-Day Rank
#10
365-Day Rank
#48
The Barnstormer
Average Posted Wait
21
7-Day Rank
#5
30-Day Rank
#19
365-Day Rank
#98
Walt Disney’s Enchanted Tiki Room
Average Posted Wait
10
7-Day Rank
#1
30-Day Rank
#1
365-Day Rank
#1
The Haunted Mansion
Average Posted Wait
25
Actual Waits Were
51%
7-Day Rank
#5
30-Day Rank
#17
365-Day Rank
#140
The Magic Carpets of Aladdin
Average Posted Wait
15
7-Day Rank
#6
30-Day Rank
#21
365-Day Rank
#82
The Many Adventures of Winnie the Pooh
Average Posted Wait
25
Actual Waits Were
72%
7-Day Rank
#6
30-Day Rank
#19
365-Day Rank
#101
Tomorrowland Speedway
Average Posted Wait
7
7-Day Rank
#6
30-Day Rank
#28
365-Day Rank
#235
Walt Disney’s Carousel of Progress
Average Posted Wait
14
7-Day Rank
#1
30-Day Rank
#1
365-Day Rank
#1
Seven Dwarfs Mine Train
Average Posted Wait
60
Actual Waits Were
69%
7-Day Rank
#6
30-Day Rank
#19
365-Day Rank
#110
Under the Sea ~ Journey of the Little Mermaid
Average Posted Wait
25
Actual Waits Were
69%
7-Day Rank
#3
30-Day Rank
#14
365-Day Rank
#84

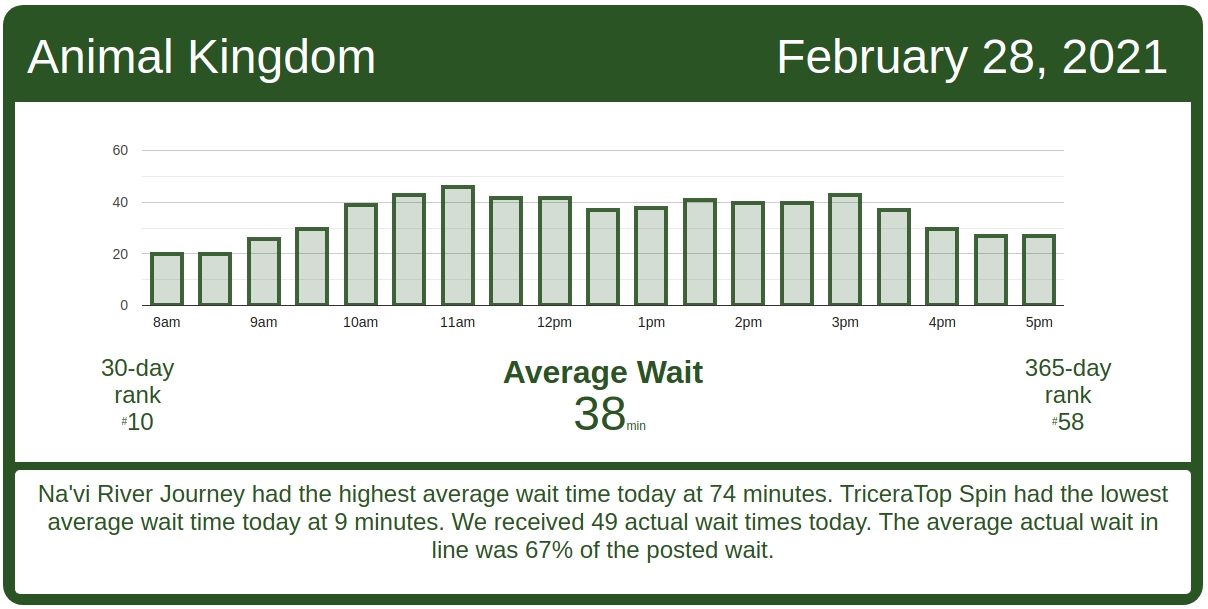
Animal Kingdom Wait Times

Avatar Flight of Passage had an average wait time today of 55 minutes. Its 7-day average is 52 minutes, so today ranks #2 for this week. Its 30-day average is 49 minutes, so today ranks #11 for the past month. Its 365-day average is 51 minutes, so today ranks #99 for the past year. We received 11 actual wait times today, and the actual wait averaged 64% of the posted wait time.

Animal Kingdom wait times for Sunday, February 28, 2021
DINOSAUR
Average Posted Wait
45
7-Day Rank
#2
30-Day Rank
#12
365-Day Rank
#57
Expedition Everest – Legend of the Forbidden Mountain
Average Posted Wait
23
Actual Waits Were
63%
7-Day Rank
#1
30-Day Rank
#10
365-Day Rank
#127
Kilimanjaro Safaris
Average Posted Wait
37
Actual Waits Were
58%
7-Day Rank
#1
30-Day Rank
#6
365-Day Rank
#29
It’s Tough to Be a Bug!
Average Posted Wait
28
7-Day Rank
#1
30-Day Rank
#8
365-Day Rank
#22
TriceraTop Spin
Average Posted Wait
9
7-Day Rank
#1
30-Day Rank
#6
365-Day Rank
#38
Na’vi River Journey
Average Posted Wait
74
Actual Waits Were
75%
7-Day Rank
#3
30-Day Rank
#8
365-Day Rank
#25
Avatar Flight of Passage
Average Posted Wait
55
Actual Waits Were
64%
7-Day Rank
#2
30-Day Rank
#11
365-Day Rank
#99

Hollywood Studios Wait Times

Toy Story Mania! had an average wait time today of 29 minutes. Its 7-day average is 35 minutes, so today ranks #6 for this week. Its 30-day average is 32 minutes, so today ranks #18 for the past month.  We received 9 actual wait times today, and the actual wait averaged 79% of the posted wait time.  That’s actually closer to the posted wait than TSM has been, I think.

Hollywood Studios wait times for Sunday, February 28, 2021
Muppet*Vision 3D
Average Posted Wait
27
7-Day Rank
#6
30-Day Rank
#19
365-Day Rank
#53
Rock ‘n’ Roller Coaster Starring Aerosmith
Average Posted Wait
41
7-Day Rank
#3
30-Day Rank
#14
365-Day Rank
#138
Star Tours: The Adventures Continue
Average Posted Wait
28
7-Day Rank
#6
30-Day Rank
#22
365-Day Rank
#108
The Twilight Zone Tower of Terror
Average Posted Wait
59
7-Day Rank
#4
30-Day Rank
#15
365-Day Rank
#57
Toy Story Mania!
Average Posted Wait
29
Actual Waits Were
79%
7-Day Rank
#6
30-Day Rank
#18
365-Day Rank
#89
Walt Disney Presents
Average Posted Wait
20
7-Day Rank
#1
30-Day Rank
#1
365-Day Rank
#1
Slinky Dog Dash
Average Posted Wait
61
Actual Waits Were
71%
7-Day Rank
#5
30-Day Rank
#15
365-Day Rank
#120
Alien Swirling Saucers
Average Posted Wait
25
7-Day Rank
#5
30-Day Rank
#20
365-Day Rank
#117
Mickey & Minnie’s Runaway Railway
Average Posted Wait
44
Actual Waits Were
62%
7-Day Rank
#6
30-Day Rank
#19
365-Day Rank
#194
Millennium Falcon: Smugglers Run
Average Posted Wait
68
7-Day Rank
#1
30-Day Rank
#5
365-Day Rank
#38

EPCOT Wait Times

Soarin’ had an average wait time today of 32 minutes. Its 7-day average is 36 minutes, so today ranks #5 for this week. Its 30-day average is 36 minutes, so today ranks #16 for the past month.We received 5 actual wait times today, and the actual wait averaged 51% of the posted wait time.  That’s low.

EPCOT wait times for Sunday, February 28, 2021
Gran Fiesta Tour Starring The Three Caballeros
Average Posted Wait
10
7-Day Rank
#2
30-Day Rank
#10
365-Day Rank
#102
Journey Into Imagination With Figment
Average Posted Wait
15
7-Day Rank
#1
30-Day Rank
#11
365-Day Rank
#81
Living with the Land
Average Posted Wait
5
7-Day Rank
#2
30-Day Rank
#21
365-Day Rank
#235
Mission: SPACE Orange
Average Posted Wait
34
7-Day Rank
#1
30-Day Rank
#7
365-Day Rank
#59
Soarin’
Average Posted Wait
32
Actual Waits Were
51%
7-Day Rank
#5
30-Day Rank
#16
365-Day Rank
#105
Spaceship Earth
Average Posted Wait
17
Actual Waits Were
35%
7-Day Rank
#3
30-Day Rank
#15
365-Day Rank
#100
Test Track
Average Posted Wait
36
Actual Waits Were
60%
7-Day Rank
#5
30-Day Rank
#28
365-Day Rank
#200
The Seas with Nemo & Friends
Average Posted Wait
5
7-Day Rank
#5
30-Day Rank
#28
365-Day Rank
#238
Frozen Ever After
Average Posted Wait
30
7-Day Rank
#2
30-Day Rank
#13
365-Day Rank
#173

The post Moderate Crowds End The Month – Disney World Wait Times for Sunday, February 28, 2021 appeared first on TouringPlans.com Blog.