More Moderate Crowds – Disney World Wait Times for Sunday, January 31, 2021

Sunday saw more moderate crowds across Walt Disney World, with all four parks’ average posted wait times in the bottom half of the past month’s numbers.  It looks like many of our Lines community were in the Magic Kingdom today – we got over 100 actual wait times from just that park today (and 170 actual wait times overall).

We counted 494 of 500 guests (99%) in Disney’s Hollywood Studios wearing masks according to Disney’s mask guidelines.  And in today’s installment of What Were They Thinking?, our in-park researcher ate lunch at PizzeRizzo.  Let’s do the numbers!

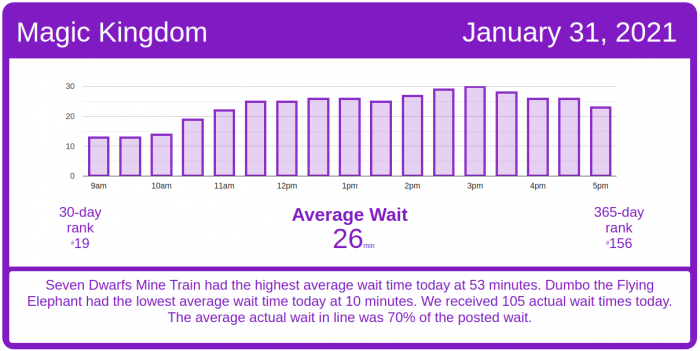
Magic Kingdom Wait Times

Space Mountain had an average wait time today of 27 minutes. Its 7-day average is 27 minutes, so today ranks #3 for this week. Its 30-day average is 41 minutes, so today ranks #22 for the past month. We received 11 actual wait times today, and the actual wait averaged 52% of the posted wait time.

Magic Kingdom wait times for Sunday, January 31, 2021
Astro Orbiter
Average Posted Wait
42
7-Day Rank
#1
30-Day Rank
#6
365-Day Rank
#24
Big Thunder Mountain Railroad
Average Posted Wait
40
Actual Waits Were
59%
7-Day Rank
#4
30-Day Rank
#21
365-Day Rank
#157
Buzz Lightyear’s Space Ranger Spin
Average Posted Wait
28
Actual Waits Were
53%
7-Day Rank
#4
30-Day Rank
#20
365-Day Rank
#139
Dumbo the Flying Elephant
Average Posted Wait
10
7-Day Rank
#3
30-Day Rank
#15
365-Day Rank
#145
“it’s a small world”
Average Posted Wait
30
Actual Waits Were
129%
7-Day Rank
#4
30-Day Rank
#23
365-Day Rank
#161
Jungle Cruise
Average Posted Wait
40
Actual Waits Were
90%
7-Day Rank
#2
30-Day Rank
#11
365-Day Rank
#127
Mad Tea Party
Average Posted Wait
10
7-Day Rank
#3
30-Day Rank
#19
365-Day Rank
#164
Mickey’s PhilharMagic
Average Posted Wait
21
7-Day Rank
#3
30-Day Rank
#17
365-Day Rank
#45
Peter Pan’s Flight
Average Posted Wait
29
Actual Waits Were
94%
7-Day Rank
#2
30-Day Rank
#15
365-Day Rank
#152
Pirates of the Caribbean
Average Posted Wait
38
Actual Waits Were
79%
7-Day Rank
#2
30-Day Rank
#20
365-Day Rank
#168
Space Mountain
Average Posted Wait
27
Actual Waits Were
52%
7-Day Rank
#3
30-Day Rank
#22
365-Day Rank
#160
Splash Mountain
Average Posted Wait
39
Actual Waits Were
53%
7-Day Rank
#3
30-Day Rank
#18
365-Day Rank
#151
The Barnstormer
Average Posted Wait
16
7-Day Rank
#4
30-Day Rank
#21
365-Day Rank
#141
The Haunted Mansion
Average Posted Wait
18
Actual Waits Were
57%
7-Day Rank
#2
30-Day Rank
#13
365-Day Rank
#186
The Magic Carpets of Aladdin
Average Posted Wait
13
7-Day Rank
#3
30-Day Rank
#17
365-Day Rank
#123
The Many Adventures of Winnie the Pooh
Average Posted Wait
23
Actual Waits Were
75%
7-Day Rank
#2
30-Day Rank
#12
365-Day Rank
#131
Tomorrowland Speedway
Average Posted Wait
12
7-Day Rank
#5
30-Day Rank
#21
365-Day Rank
#168
Seven Dwarfs Mine Train
Average Posted Wait
53
7-Day Rank
#3
30-Day Rank
#21
365-Day Rank
#147
Under the Sea ~ Journey of the Little Mermaid
Average Posted Wait
17
Actual Waits Were
28%
7-Day Rank
#3
30-Day Rank
#16
365-Day Rank
#161

Animal Kingdom Wait Times

Kilimanjaro Safaris had an average wait time today of 18 minutes. Its 7-day average is 13 minutes, so today ranks #1 for this week. Its 30-day average is 18 minutes, so today ranks #13 for the past month.  We received 4 actual wait times today, and the actual wait averaged 38% of the posted wait time – come on, Wilson!

Animal Kingdom wait times for Sunday, January 31, 2021
DINOSAUR
Average Posted Wait
37
7-Day Rank
#1
30-Day Rank
#14
365-Day Rank
#101
Expedition Everest – Legend of the Forbidden Mountain
Average Posted Wait
18
Actual Waits Were
51%
7-Day Rank
#1
30-Day Rank
#15
365-Day Rank
#183
Kilimanjaro Safaris
Average Posted Wait
18
Actual Waits Were
38%
7-Day Rank
#1
30-Day Rank
#13
365-Day Rank
#140
It’s Tough to Be a Bug!
Average Posted Wait
13
7-Day Rank
#1
30-Day Rank
#11
365-Day Rank
#107
TriceraTop Spin
Average Posted Wait
5
7-Day Rank
#1
30-Day Rank
#3
365-Day Rank
#77
Na’vi River Journey
Average Posted Wait
52
7-Day Rank
#1
30-Day Rank
#10
365-Day Rank
#88
Avatar Flight of Passage
Average Posted Wait
37
Actual Waits Were
74%
7-Day Rank
#1
30-Day Rank
#15
365-Day Rank
#159

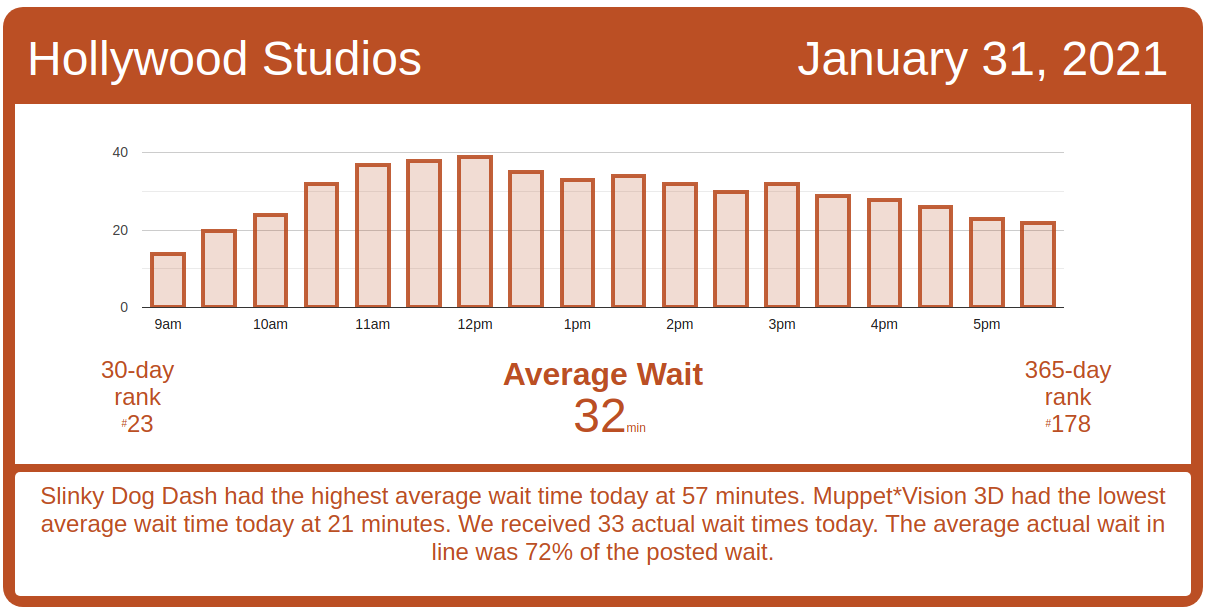
Hollywood Studios Wait Times

Rock ‘n’ Roller Coaster Starring Simple Minds had an average wait time today of 29 minutes. Its 7-day average is 30 minutes, so today ranks #3 for this week. Its 30-day average is 37 minutes, so today ranks #20 for the past month. Its 365-day average is 50 minutes, so today ranks #202 for the past year. We received 5 actual wait times today, and the actual wait averaged 59% of the posted wait time.

Hollywood Studios wait times for Sunday, January 31, 2021

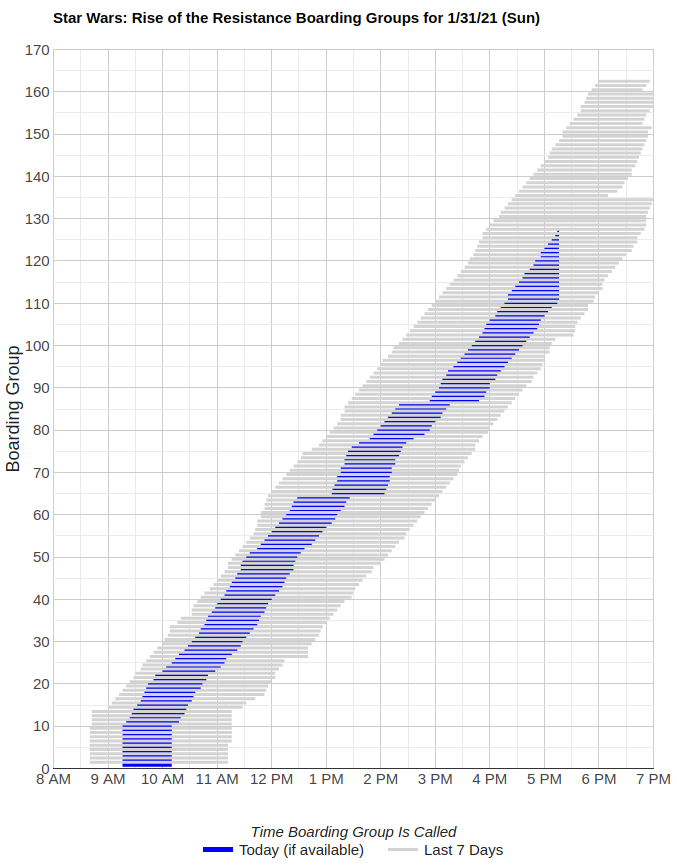
Rise of the Resistance had a couple of delays today in calling boarding groups, after a fabulous day of operations yesterday.  The first delay Rise of the Resistance had in calling boarding groups was around 12:30 p.m. and boarding group 65.  That delay lasted around 40 minutes.  There was another slight delay around boarding group 87 at 2:20 p.m., and that lasted about 40 minutes as well.

Rise of the Resistance is up to boarding group 127 as I write this, and there’s a good chance it’ll get above 140 before the park closes today.

Rise of the Resistance boarding groups for Sunday, January 31, 2021
Muppet*Vision 3D
Average Posted Wait
21
7-Day Rank
#6
30-Day Rank
#29
365-Day Rank
#59
Rock ‘n’ Roller Coaster Starring Aerosmith
Average Posted Wait
29
Actual Waits Were
59%
7-Day Rank
#3
30-Day Rank
#20
365-Day Rank
#202
Star Tours: The Adventures Continue
Average Posted Wait
26
7-Day Rank
#5
30-Day Rank
#23
365-Day Rank
#124
The Twilight Zone Tower of Terror
Average Posted Wait
42
7-Day Rank
#5
30-Day Rank
#27
365-Day Rank
#173
Toy Story Mania!
Average Posted Wait
21
Actual Waits Were
59%
7-Day Rank
#6
30-Day Rank
#26
365-Day Rank
#178
Slinky Dog Dash
Average Posted Wait
57
Actual Waits Were
65%
7-Day Rank
#1
30-Day Rank
#11
365-Day Rank
#147
Alien Swirling Saucers
Average Posted Wait
21
7-Day Rank
#6
30-Day Rank
#25
365-Day Rank
#171
Mickey & Minnie’s Runaway Railway
Average Posted Wait
38
Actual Waits Were
81%
7-Day Rank
#6
30-Day Rank
#23
365-Day Rank
#202
Millennium Falcon: Smugglers Run
Average Posted Wait
47
Actual Waits Were
99%
7-Day Rank
#1
30-Day Rank
#18
365-Day Rank
#168

EPCOT Wait Times

Test Track had an average wait time today of 50 minutes. Its 7-day average is 44 minutes, so today ranks #1 for this week. Its 30-day average is 55 minutes, so today ranks #20 for the past month. Its 365-day average is 55 minutes, so today ranks #123 for the past year. We received 4 actual wait times today, and the actual wait averaged 56% of the posted wait time.

EPCOT wait times for Sunday, January 31, 2021
Gran Fiesta Tour Starring The Three Caballeros
Average Posted Wait
5
7-Day Rank
#4
30-Day Rank
#18
365-Day Rank
#216
Journey Into Imagination With Figment
Average Posted Wait
7
7-Day Rank
#3
30-Day Rank
#16
365-Day Rank
#172
Living with the Land
Average Posted Wait
5
7-Day Rank
#6
30-Day Rank
#29
365-Day Rank
#243
Mission: SPACE Orange
Average Posted Wait
15
7-Day Rank
#4
30-Day Rank
#26
365-Day Rank
#199
Soarin’
Average Posted Wait
22
7-Day Rank
#1
30-Day Rank
#17
365-Day Rank
#172
Spaceship Earth
Average Posted Wait
14
7-Day Rank
#3
30-Day Rank
#19
365-Day Rank
#145
Test Track
Average Posted Wait
50
Actual Waits Were
56%
7-Day Rank
#1
30-Day Rank
#20
365-Day Rank
#123
The Seas with Nemo & Friends
Average Posted Wait
5
7-Day Rank
#6
30-Day Rank
#29
365-Day Rank
#239
Mission: SPACE Green
Average Posted Wait
0
7-Day Rank
#6
30-Day Rank
#29
365-Day Rank
#246
Frozen Ever After
Average Posted Wait
24
7-Day Rank
#1
30-Day Rank
#14
365-Day Rank
#213

The post More Moderate Crowds – Disney World Wait Times for Sunday, January 31, 2021 appeared first on TouringPlans.com Blog.