Low Crowds Start the Weekend – Disney World Wait Times for Saturday, January 23, 2021

Low crowds continued into this weekend at Walt Disney World, with no park experiencing crowds high enough to make the top 10 days of the past month.  EPCOT’s posted wait times average for today had it as the 19th-ranked day of the past month, but that doesn’t take into account that the actual wait times we measured at EPCOT were about half of the posted wait times.  It was slow.

We counted 488 of 500 guests (98%) at Magic Kingdom wearing face masks according to Disney’s rules.  And we got exactly 100 actual wait times from our fabulous Lines community.  Let’s do the rest of the numbers!

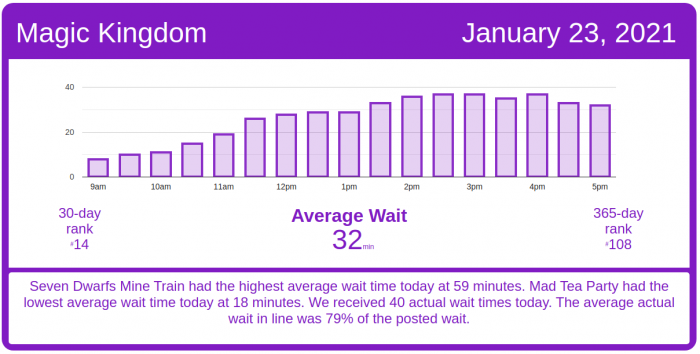
Magic Kingdom Wait Times

Big Thunder Mountain Railroad’s actual wait times had been much lower than its posteds for a while, but it seems to be back on track today.  BTMRR had an average wait time today of 42 minutes. We received 4 actual wait times today, and the actual wait averaged 85% of the posted wait time.

Magic Kingdom wait times for Saturday, January 23, 2021
Astro Orbiter
Average Posted Wait
40
7-Day Rank
#2
30-Day Rank
#12
365-Day Rank
#42
Big Thunder Mountain Railroad
Average Posted Wait
42
Actual Waits Were
85%
7-Day Rank
#3
30-Day Rank
#23
365-Day Rank
#149
Buzz Lightyear’s Space Ranger Spin
Average Posted Wait
39
Actual Waits Were
85%
7-Day Rank
#1
30-Day Rank
#12
365-Day Rank
#81
Dumbo the Flying Elephant
Average Posted Wait
20
7-Day Rank
#1
30-Day Rank
#8
365-Day Rank
#68
“it’s a small world”
Average Posted Wait
42
7-Day Rank
#1
30-Day Rank
#14
365-Day Rank
#70
Jungle Cruise
Average Posted Wait
34
Actual Waits Were
99%
7-Day Rank
#3
30-Day Rank
#22
365-Day Rank
#170
Mad Tea Party
Average Posted Wait
18
7-Day Rank
#1
30-Day Rank
#11
365-Day Rank
#58
Mickey’s PhilharMagic
Average Posted Wait
28
7-Day Rank
#1
30-Day Rank
#15
365-Day Rank
#32
Peter Pan’s Flight
Average Posted Wait
37
7-Day Rank
#1
30-Day Rank
#15
365-Day Rank
#114
Pirates of the Caribbean
Average Posted Wait
43
7-Day Rank
#1
30-Day Rank
#18
365-Day Rank
#143
Space Mountain
Average Posted Wait
42
Actual Waits Were
71%
7-Day Rank
#1
30-Day Rank
#19
365-Day Rank
#119
Splash Mountain
Average Posted Wait
34
Actual Waits Were
69%
7-Day Rank
#5
30-Day Rank
#22
365-Day Rank
#161
The Barnstormer
Average Posted Wait
25
7-Day Rank
#1
30-Day Rank
#13
365-Day Rank
#90
The Haunted Mansion
Average Posted Wait
22
Actual Waits Were
59%
7-Day Rank
#1
30-Day Rank
#13
365-Day Rank
#177
The Magic Carpets of Aladdin
Average Posted Wait
18
7-Day Rank
#1
30-Day Rank
#9
365-Day Rank
#68
The Many Adventures of Winnie the Pooh
Average Posted Wait
29
7-Day Rank
#1
30-Day Rank
#10
365-Day Rank
#84
Tomorrowland Speedway
Average Posted Wait
20
7-Day Rank
#1
30-Day Rank
#14
365-Day Rank
#90
Seven Dwarfs Mine Train
Average Posted Wait
59
7-Day Rank
#2
30-Day Rank
#20
365-Day Rank
#130
Under the Sea ~ Journey of the Little Mermaid
Average Posted Wait
26
7-Day Rank
#1
30-Day Rank
#12
365-Day Rank
#97

Animal Kingdom Wait Times

Avatar Flight of Passage had an average wait time today of 41 minutes. Its 7-day average is 37 minutes, so today ranks #2 for this week. Its 30-day average is 55 minutes, so today ranks #18 for the past month. Its 365-day average is 68 minutes, so today ranks #153 for the past year. We received 6 actual wait times today, and the actual wait averaged 98% of the posted wait time.

Animal Kingdom wait times for Saturday, January 23, 2021
DINOSAUR
Average Posted Wait
39
7-Day Rank
#2
30-Day Rank
#17
365-Day Rank
#94
Expedition Everest – Legend of the Forbidden Mountain
Average Posted Wait
20
Actual Waits Were
53%
7-Day Rank
#2
30-Day Rank
#20
365-Day Rank
#175
Kilimanjaro Safaris
Average Posted Wait
16
Actual Waits Were
38%
7-Day Rank
#2
30-Day Rank
#20
365-Day Rank
#166
It’s Tough to Be a Bug!
Average Posted Wait
13
7-Day Rank
#2
30-Day Rank
#20
365-Day Rank
#115
TriceraTop Spin
Average Posted Wait
5
7-Day Rank
#1
30-Day Rank
#8
365-Day Rank
#93
Na’vi River Journey
Average Posted Wait
48
7-Day Rank
#2
30-Day Rank
#20
365-Day Rank
#117
Avatar Flight of Passage
Average Posted Wait
41
Actual Waits Were
98%
7-Day Rank
#2
30-Day Rank
#18
365-Day Rank
#153

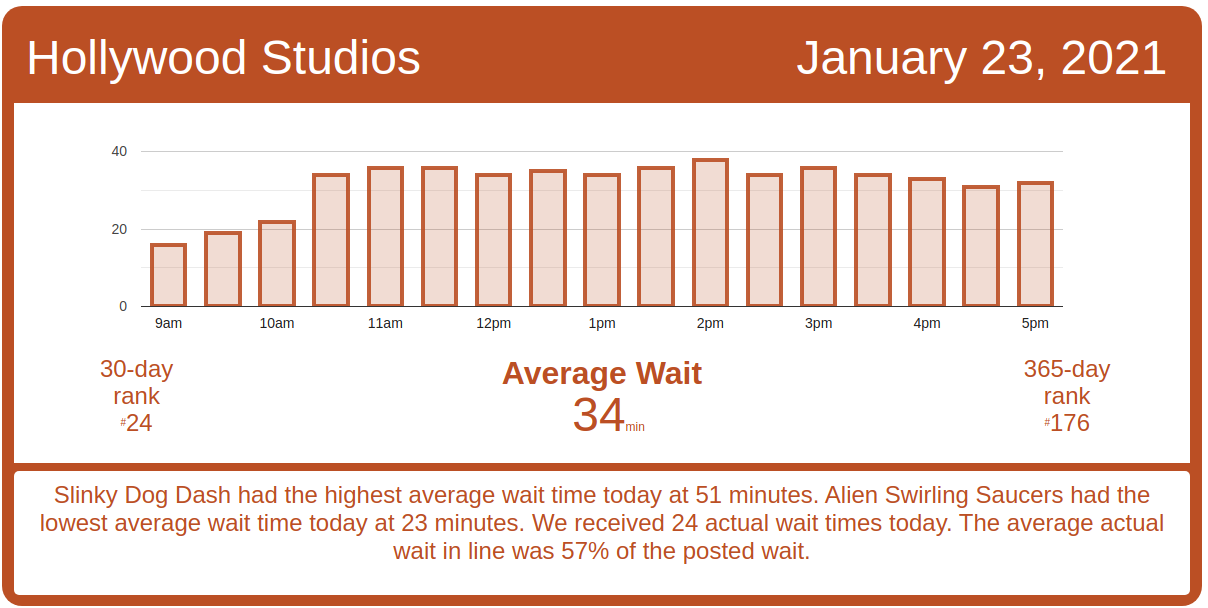
Hollywood Studios Wait Times

Toy Story Mania! had an average wait time today of 27 minutes. Its 7-day average is 25 minutes, so today ranks #2 for this week. Its 30-day average is 31 minutes, so today ranks #18 for the past month. Its 365-day average is 33 minutes, so today ranks #130 for the past year. We received 5 actual wait times today, and the actual wait averaged 39% of the posted wait time.

Studios wait times for Saturday, January 23, 2021

Rise of the Resistance has had a couple of delays in calling boarding groups today.  Things got started well this morning, with Rise of the Resistance starting to call boarding groups around 8:45 a.m.  There was a short pause of around 15 minutes at boarding group 14 right after that.  A second delay happened at boarding group 31 from 10 a.m. until around 10:40 a.m.

There were two afternoon delays in calling boarding groups: one around boarding group 93 just before 3 p.m., and another around boarding group 117 around 4:40 p.m. that lasted until 5 p.m.


Rise of the Resistance boarding groups for Saturday, January 23, 2021
Muppet*Vision 3D
Average Posted Wait
24
7-Day Rank
#3
30-Day Rank
#26
365-Day Rank
#45
Rock ‘n’ Roller Coaster Starring Aerosmith
Average Posted Wait
34
7-Day Rank
#2
30-Day Rank
#22
365-Day Rank
#189
Star Tours: The Adventures Continue
Average Posted Wait
31
7-Day Rank
#3
30-Day Rank
#22
365-Day Rank
#88
The Twilight Zone Tower of Terror
Average Posted Wait
47
7-Day Rank
#3
30-Day Rank
#24
365-Day Rank
#141
Toy Story Mania!
Average Posted Wait
27
Actual Waits Were
39%
7-Day Rank
#2
30-Day Rank
#18
365-Day Rank
#130
Slinky Dog Dash
Average Posted Wait
51
Actual Waits Were
50%
7-Day Rank
#4
30-Day Rank
#24
365-Day Rank
#175
Alien Swirling Saucers
Average Posted Wait
23
7-Day Rank
#3
30-Day Rank
#22
365-Day Rank
#156
Mickey & Minnie’s Runaway Railway
Average Posted Wait
41
Actual Waits Were
69%
7-Day Rank
#2
30-Day Rank
#20
365-Day Rank
#188
Millennium Falcon: Smugglers Run
Average Posted Wait
49
7-Day Rank
#2
30-Day Rank
#23
365-Day Rank
#170

EPCOT Wait Times

Soarin’ had an average wait time today of 33 minutes. Its 7-day average is 26 minutes, so today ranks #2 for this week. Its 30-day average is 40 minutes, so today ranks #15 for the past month. Its 365-day average is 36 minutes, so today ranks #122 for the past year. We received 4 actual wait times today, and the actual wait averaged 47% of the posted wait time.

EPCOT wait times for Saturday, January 23, 2021
Gran Fiesta Tour Starring The Three Caballeros
Average Posted Wait
5
7-Day Rank
#5
30-Day Rank
#25
365-Day Rank
#227
Journey Into Imagination With Figment
Average Posted Wait
18
7-Day Rank
#1
30-Day Rank
#12
365-Day Rank
#79
Living with the Land
Average Posted Wait
10
Actual Waits Were
40%
7-Day Rank
#1
30-Day Rank
#12
365-Day Rank
#169
Mission: SPACE Orange
Average Posted Wait
24
7-Day Rank
#2
30-Day Rank
#21
365-Day Rank
#124
Soarin’
Average Posted Wait
33
Actual Waits Were
47%
7-Day Rank
#2
30-Day Rank
#15
365-Day Rank
#122
Spaceship Earth
Average Posted Wait
23
7-Day Rank
#1
30-Day Rank
#10
365-Day Rank
#83
Test Track
Average Posted Wait
51
7-Day Rank
#3
30-Day Rank
#25
365-Day Rank
#117
The Seas with Nemo & Friends
Average Posted Wait
11
7-Day Rank
#1
30-Day Rank
#11
365-Day Rank
#121
Frozen Ever After
Average Posted Wait
29
7-Day Rank
#3
30-Day Rank
#14
365-Day Rank
#197

The post Low Crowds Start the Weekend – Disney World Wait Times for Saturday, January 23, 2021 appeared first on TouringPlans.com Blog.