It’s Sloooowww – Disney World Wait Times for Wednesday, January 13, 2021

Another day of lowest-crowds-in-a-month numbers out of Walt Disney World.  That’s not unexpected – there’s no Walt Disney World Marathon this week, so it’s a midweek day in January. In a pandemic. With few hotel discounts.  Totally understandable.  And even as low as these wait time numbers are, we’re pretty sure EPCOT was even less crowded, because the actual wait times in line were less than half of the posted.

We received 108 actual wait times today from users of our Lines app.  And we counted 494 of 500 guests (99%) in the Magic Kingdom wearing masks according to Disney’s guidelines. Let’s do the rest of the numbers!

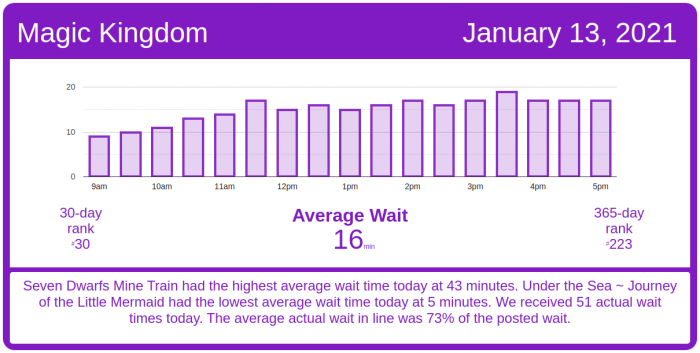
Magic Kingdom Wait Times

To put today’s wait times in perspective, the average posted waits at Haunted Mansion, Peter Pan’s Flight, and Mad Tea Party rank as the 240th-highest, 239th-highest, and 251st-highest for the past year.  But the Magic Kingdom was closed for 112 days (reopening for cast members on July 7), so today’s waits are close to the year-long lows for those attractions.

Magic Kingdom wait times for Wednesday, January 13, 2021
Astro Orbiter
Average Posted Wait
30
7-Day Rank
#6
30-Day Rank
#29
365-Day Rank
#143
Big Thunder Mountain Railroad
Average Posted Wait
31
Actual Waits Were
56%
7-Day Rank
#6
30-Day Rank
#29
365-Day Rank
#200
Buzz Lightyear’s Space Ranger Spin
Average Posted Wait
17
Actual Waits Were
59%
7-Day Rank
#6
30-Day Rank
#29
365-Day Rank
#193
Dumbo the Flying Elephant
Average Posted Wait
7
7-Day Rank
#6
30-Day Rank
#29
365-Day Rank
#202
“it’s a small world”
Average Posted Wait
25
7-Day Rank
#6
30-Day Rank
#30
365-Day Rank
#199
Jungle Cruise
Average Posted Wait
24
Actual Waits Were
62%
7-Day Rank
#6
30-Day Rank
#29
365-Day Rank
#223
Mad Tea Party
Average Posted Wait
5
7-Day Rank
#6
30-Day Rank
#30
365-Day Rank
#251
Mickey’s PhilharMagic
Average Posted Wait
16
7-Day Rank
#6
30-Day Rank
#29
365-Day Rank
#122
Peter Pan’s Flight
Average Posted Wait
17
Actual Waits Were
100%
7-Day Rank
#6
30-Day Rank
#29
365-Day Rank
#240
Pirates of the Caribbean
Average Posted Wait
26
Actual Waits Were
106%
7-Day Rank
#6
30-Day Rank
#29
365-Day Rank
#211
Space Mountain
Average Posted Wait
16
Actual Waits Were
75%
7-Day Rank
#6
30-Day Rank
#29
365-Day Rank
#200
Splash Mountain
Average Posted Wait
7
7-Day Rank
#6
30-Day Rank
#29
365-Day Rank
#200
The Barnstormer
Average Posted Wait
6
7-Day Rank
#6
30-Day Rank
#29
365-Day Rank
#214
The Haunted Mansion
Average Posted Wait
9
Actual Waits Were
26%
7-Day Rank
#6
30-Day Rank
#29
365-Day Rank
#241
The Magic Carpets of Aladdin
Average Posted Wait
7
7-Day Rank
#6
30-Day Rank
#30
365-Day Rank
#246
The Many Adventures of Winnie the Pooh
Average Posted Wait
17
7-Day Rank
#6
30-Day Rank
#29
365-Day Rank
#205
Tomorrowland Speedway
Average Posted Wait
7
7-Day Rank
#6
30-Day Rank
#31
365-Day Rank
#235
Seven Dwarfs Mine Train
Average Posted Wait
43
Actual Waits Were
69%
7-Day Rank
#6
30-Day Rank
#29
365-Day Rank
#179
Under the Sea ~ Journey of the Little Mermaid
Average Posted Wait
5
7-Day Rank
#6
30-Day Rank
#29
365-Day Rank
#248

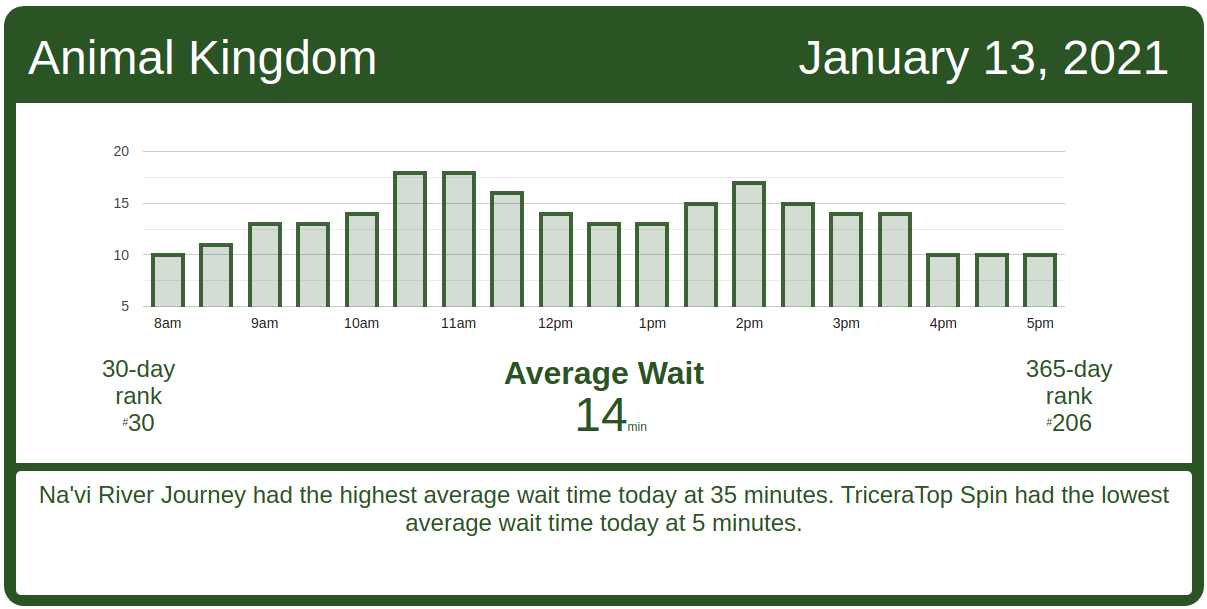
Animal Kingdom Wait Times

Avatar Flight of Passage had an average wait time today of 17 minutes. Its 7-day average is 39 minutes, so today ranks #6 for this week. Its 30-day average is 65 minutes, so today ranks #29 for the past month. Its 365-day average is 73 minutes, so today ranks #209 for the past year. We received 4 actual wait times today, and the actual wait averaged 77% of the posted wait time.

Animal Kingdom wait times for Wednesday, January 13, 2021
DINOSAUR
Average Posted Wait
15
7-Day Rank
#6
30-Day Rank
#28
365-Day Rank
#182
Expedition Everest – Legend of the Forbidden Mountain
Average Posted Wait
11
7-Day Rank
#5
30-Day Rank
#28
365-Day Rank
#235
Kilimanjaro Safaris
Average Posted Wait
7
7-Day Rank
#6
30-Day Rank
#29
365-Day Rank
#243
It’s Tough to Be a Bug!
Average Posted Wait
10
7-Day Rank
#6
30-Day Rank
#28
365-Day Rank
#167
TriceraTop Spin
Average Posted Wait
5
7-Day Rank
#1
30-Day Rank
#9
365-Day Rank
#99
Na’vi River Journey
Average Posted Wait
35
7-Day Rank
#6
30-Day Rank
#29
365-Day Rank
#183
Avatar Flight of Passage
Average Posted Wait
17
Actual Waits Were
77%
7-Day Rank
#6
30-Day Rank
#29
365-Day Rank
#209

Hollywood Studios Wait Times

Rock ‘n’ Roller Coaster Starring John Mellencamp had an average wait time today of 26 minutes. Its 7-day average is 45 minutes, so today ranks #6 for this week. Its 30-day average is 48 minutes, so today ranks #28 for the past month. Its 365-day average is 54 minutes, so today ranks #220 for the past year. We received 8 actual wait times today, and the actual wait averaged 54% of the posted wait time.

Hollywood Studios wait times for Wednesday, January 13, 2021

Rise of the Resistance has had a normal day of operations while calling boarding groups.  Rise had one small delay this afternoon, for about 30 minutes starting at 2 p.m. with Boarding Group 85, and boarding groups have been called steadily since then.  Rise of the Resistance is approaching boarding group 130 as I write this.

Rise of the Resistance boarding groups for Wednesday, January 13, 2021
Muppet*Vision 3D
Average Posted Wait
28
7-Day Rank
#3
30-Day Rank
#25
365-Day Rank
#30
Rock ‘n’ Roller Coaster Starring Aerosmith
Average Posted Wait
26
Actual Waits Were
54%
7-Day Rank
#6
30-Day Rank
#28
365-Day Rank
#220
Star Tours: The Adventures Continue
Average Posted Wait
24
Actual Waits Were
41%
7-Day Rank
#6
30-Day Rank
#29
365-Day Rank
#147
The Twilight Zone Tower of Terror
Average Posted Wait
42
Actual Waits Were
86%
7-Day Rank
#6
30-Day Rank
#29
365-Day Rank
#173
Toy Story Mania!
Average Posted Wait
20
Actual Waits Were
62%
7-Day Rank
#6
30-Day Rank
#29
365-Day Rank
#187
Slinky Dog Dash
Average Posted Wait
43
7-Day Rank
#6
30-Day Rank
#29
365-Day Rank
#196
Alien Swirling Saucers
Average Posted Wait
20
7-Day Rank
#6
30-Day Rank
#29
365-Day Rank
#184
Mickey & Minnie’s Runaway Railway
Average Posted Wait
35
Actual Waits Were
74%
7-Day Rank
#6
30-Day Rank
#28
365-Day Rank
#195
Millennium Falcon: Smugglers Run
Average Posted Wait
37
Actual Waits Were
65%
7-Day Rank
#6
30-Day Rank
#29
365-Day Rank
#216

EPCOT Wait Times

It was likely close to the slowest day of the past year at Frozen Ever After, which had an average wait time today of 21 minutes. Its 7-day average is 25 minutes, so today ranks #4 for this week. Its 30-day average is 41 minutes, so today ranks #26 for the past month. Its 365-day average is 55 minutes, so today ranks #236 for the past year. We received 5 actual wait times today, and the actual wait averaged 48% of the posted wait time.

EPCOT wait times for Wednesday, January 13, 2021
Gran Fiesta Tour Starring The Three Caballeros
Average Posted Wait
5
7-Day Rank
#5
30-Day Rank
#29
365-Day Rank
#225
Journey Into Imagination With Figment
Average Posted Wait
5
7-Day Rank
#6
30-Day Rank
#30
365-Day Rank
#244
Living with the Land
Average Posted Wait
5
7-Day Rank
#6
30-Day Rank
#29
365-Day Rank
#243
Mission: SPACE Orange
Average Posted Wait
38
7-Day Rank
#1
30-Day Rank
#16
365-Day Rank
#54
Soarin’
Average Posted Wait
22
Actual Waits Were
46%
7-Day Rank
#5
30-Day Rank
#28
365-Day Rank
#183
Spaceship Earth
Average Posted Wait
9
7-Day Rank
#6
30-Day Rank
#29
365-Day Rank
#189
Test Track
Average Posted Wait
48
7-Day Rank
#5
30-Day Rank
#29
365-Day Rank
#122
The Seas with Nemo & Friends
Average Posted Wait
10
7-Day Rank
#3
30-Day Rank
#18
365-Day Rank
#150
Frozen Ever After
Average Posted Wait
21
Actual Waits Were
48%
7-Day Rank
#4
30-Day Rank
#26
365-Day Rank
#236


The post It’s Sloooowww – Disney World Wait Times for Wednesday, January 13, 2021 appeared first on TouringPlans.com Blog.