
For the past few days we’ve just been watching Disney posted wait times get lower and lower, and the actual wait times have been even lower. Each of the park’s actual wait times today were around 60% of the posted wait times. Thanks to our Lines app users for submitting their actual wait times.
Today Disney’s Hollywood Studios and EPCOT have the lowest wait times of the past 30 days. At Disney’s Animal Kingdom our team observed just 5 guests out of 500 that were not wearing their masks in accordance with Disney’s guidelines. Let’s dig into the numbers.
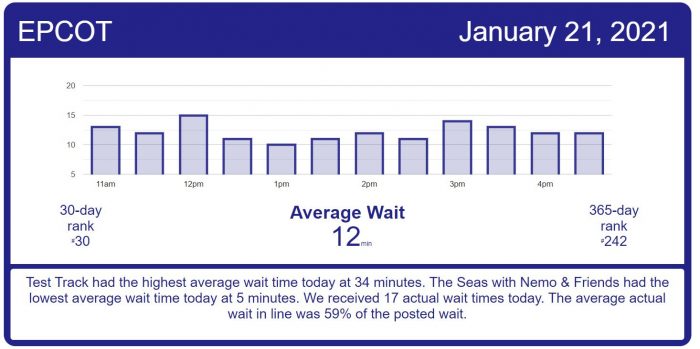
EPCOT Wait Times

Journey Into Imagination With Figment had an average wait time today of 5 minutes. Its 7-day average is 11 minutes, so today ranks #6 for this week. Its 30-day average is 16 minutes, so today ranks #30 for the past month. Its 365-day average is 15 minutes, so today ranks #244 for the past year.
Living with the Land had an average wait time today of 5 minutes. Its 7-day average is 8 minutes, so today ranks #6 for this week. Its 30-day average is 10 minutes, so today ranks #29 for the past month. Its 365-day average is 13 minutes, so today ranks #243 for the past year.
Soarin’ had an average wait time today of 15 minutes. Its 7-day average is 33 minutes, so today ranks #6 for this week. Its 30-day average is 41 minutes, so today ranks #29 for the past month. We received 5 actual wait times today, and the actual wait averaged 59% of the posted wait time.
Spaceship Earth had an average wait time today of 9 minutes. Its 7-day average is 18 minutes, so today ranks #6 for this week. Its 30-day average is 22 minutes, so today ranks #29 for the past month. Its 365-day average is 19 minutes, so today ranks #192 for the past year.
The Seas with Nemo & Friends had an average wait time today of 5 minutes. Its 7-day average is 11 minutes, so today ranks #6 for this week. Its 30-day average is 13 minutes, so today ranks #29 for the past month. Its 365-day average is 14 minutes, so today ranks #239 for the past year.
Frozen Ever After had an average wait time today of 16 minutes. Its 7-day average is 29 minutes, so today ranks #5 for this week. Its 30-day average is 33 minutes, so today ranks #28 for the past month. Its 365-day average is 54 minutes, so today ranks #238 for the past year.
Disney’s Hollywood Studios Wait Times

Rock ‘n’ Roller Coaster Starring Foo Fighters (it’s actually Aerosmith, I’m just still hyped about last night’s inauguration performance) had an average wait time today of 19 minutes. Its 7-day average is 38 minutes, so today ranks #5 for this week. Its 30-day average is 45 minutes, so today ranks #27 for the past month. We received 5 actual wait times today, and the actual wait averaged 55% of the posted wait time.
Toy Story Mania! had an average wait time today of 18 minutes. Its 7-day average is 29 minutes, so today ranks #6 for this week. Its 30-day average is 32 minutes, so today ranks #29 for the past month. We received 5 actual wait times today, and the actual wait averaged 70% of the posted wait time.
Slinky Dog Dash had an average wait time today of 42 minutes. Its 7-day average is 64 minutes, so today ranks #6 for this week. Its 30-day average is 64 minutes, so today ranks #29 for the past month. Its 365-day average is 67 minutes, so today ranks #199 for the past year.
Mickey & Minnie’s Runaway Railway had an average wait time today of 31 minutes. Its 7-day average is 43 minutes, so today ranks #6 for this week. Its 30-day average is 45 minutes, so today ranks #28 for the past month. Its 365-day average is 63 minutes, so today ranks #203 for the past year.
Millennium Falcon: Smugglers Run had an average wait time today of 34 minutes. Its 7-day average is 52 minutes, so today ranks #5 for this week. Its 30-day average is 61 minutes, so today ranks #27 for the past month. Its 365-day average is 58 minutes, so today ranks #225 for the past year.
Rise of the Resistance operations started off a little slower than the past 7 days, but after lunch time the boarding groups being called started to be on pace without any gaps.

Disney’s Animal Kingdom Wait Times

DINOSAUR had an average wait time today of 35 minutes. Its 7-day average is 39 minutes, so today ranks #3 for this week. Its 30-day average is 44 minutes, so today ranks #19 for the past month. Its 365-day average is 32 minutes, so today ranks #114 for the past year.
Expedition Everest – Legend of the Forbidden Mountain had an average wait time today of 9 minutes. Its 7-day average is 21 minutes, so today ranks #6 for this week. Its 30-day average is 28 minutes, so today ranks #29 for the past month. Its 365-day average is 37 minutes, so today ranks #241 for the past year.
Kilimanjaro Safaris had an average wait time today of 10 minutes. Its 7-day average is 18 minutes, so today ranks #3 for this week. Its 30-day average is 24 minutes, so today ranks #22 for the past month. Its 365-day average is 36 minutes, so today ranks #223 for the past year.
Na’vi River Journey had an average wait time today of 37 minutes. Its 7-day average is 47 minutes, so today ranks #4 for this week. Its 30-day average is 60 minutes, so today ranks #25 for the past month. Its 365-day average is 51 minutes, so today ranks #172 for the past year.
Avatar Flight of Passage had an average wait time today of 19 minutes. Its 7-day average is 45 minutes, so today ranks #4 for this week. Its 30-day average is 57 minutes, so today ranks #26 for the past month. Its 365-day average is 69 minutes, so today ranks #204 for the past year.

Magic Kingdom Wait Times

Big Thunder Mountain Railroad had an average wait time today of 23 minutes. Its 7-day average is 49 minutes, so today ranks #6 for this week. Its 30-day average is 54 minutes, so today ranks #29 for the past month. We received 4 actual wait times today, and the actual wait averaged 42% of the posted wait time.
Buzz Lightyear’s Space Ranger Spin had an average wait time today of 13 minutes. Its 7-day average is 33 minutes, so today ranks #6 for this week. Its 30-day average is 37 minutes, so today ranks #29 for the past month. Its 365-day average is 32 minutes, so today ranks #210 for the past year.
Dumbo the Flying Elephant had an average wait time today of 6 minutes. Its 7-day average is 14 minutes, so today ranks #6 for this week. Its 30-day average is 15 minutes, so today ranks #29 for the past month. Its 365-day average is 18 minutes, so today ranks #221 for the past year.
Jungle Cruise had an average wait time today of 24 minutes. Its 7-day average is 36 minutes, so today ranks #6 for this week. Its 30-day average is 43 minutes, so today ranks #29 for the past month. Its 365-day average is 46 minutes, so today ranks #224 for the past year.
Mad Tea Party had an average wait time today of 6 minutes. Its 7-day average is 16 minutes, so today ranks #6 for this week. Its 30-day average is 16 minutes, so today ranks #29 for the past month. Its 365-day average is 14 minutes, so today ranks #245 for the past year.
Mickey’s PhilharMagic had an average wait time today of 15 minutes. Its 7-day average is 24 minutes, so today ranks #6 for this week. Its 30-day average is 28 minutes, so today ranks #29 for the past month. Its 365-day average is 17 minutes, so today ranks #137 for the past year.
Space Mountain had an average wait time today of 15 minutes. Its 7-day average is 41 minutes, so today ranks #6 for this week. Its 30-day average is 52 minutes, so today ranks #29 for the past month. Its 365-day average is 48 minutes, so today ranks #208 for the past year.
Splash Mountain had an average wait time today of 29 minutes. Its 7-day average is 46 minutes, so today ranks #6 for this week. Its 30-day average is 53 minutes, so today ranks #25 for the past month. Its 365-day average is 50 minutes, so today ranks #177 for the past year.
The Haunted Mansion had an average wait time today of 9 minutes. Its 7-day average is 23 minutes, so today ranks #6 for this week. Its 30-day average is 24 minutes, so today ranks #29 for the past month. Its 365-day average is 35 minutes, so today ranks #241 for the past year.
Tomorrowland Speedway had an average wait time today of 9 minutes. Its 7-day average is 18 minutes, so today ranks #6 for this week. Its 30-day average is 20 minutes, so today ranks #28 for the past month. Its 365-day average is 19 minutes, so today ranks #215 for the past year.
Seven Dwarfs Mine Train had an average wait time today of 43 minutes. Its 7-day average is 64 minutes, so today ranks #6 for this week. Its 30-day average is 74 minutes, so today ranks #29 for the past month. Its 365-day average is 69 minutes, so today ranks #178 for the past year.
The post Hollywood Studios Has Its Slowest Day of the Past Month – Disney World Wait Times for Thursday, January 21, 2021 appeared first on TouringPlans.com Blog.