Saying Goodbye to 2020 — Disney World Wait Times for December 31, 2020

New Year’s Eve is traditionally the busiest day of the year at Walt Disney World.  With capacity limits and no scheduled fireworks, though, it’s likely today won’t even be in the top 50 for any park. (EPCOT’s wait times today are grossly inflated – a trend we’ve seen for a while now.)

We counted 487 of 500 guests (97%) wearing masks according to Disney’s guidelines today at Hollywood Studios.  We received 161 actual wait times today. Let’s do the numbers!

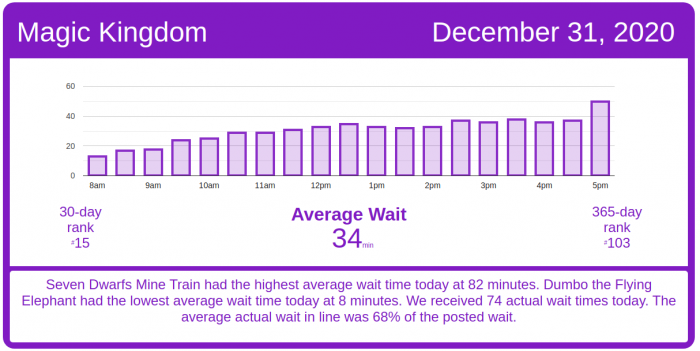
Magic Kingdom Wait Times

Big Thunder Mountain Railroad had an average wait time today of 53 minutes. Its 7-day average is 58 minutes, so today ranks #5 for this week. Its 30-day average is 56 minutes, so today ranks #17 for the past month. Its 365-day average is 50 minutes, so today ranks #91 for the past year. We received 9 actual wait times today, and the actual wait averaged 55% of the posted wait time.

Magic Kingdom wait times for Thursday, December 31, 2020
Astro Orbiter
Average Posted Wait
36
7-Day Rank
#5
30-Day Rank
#21
365-Day Rank
#79
Big Thunder Mountain Railroad
Average Posted Wait
53
Actual Waits Were
55%
7-Day Rank
#5
30-Day Rank
#17
365-Day Rank
#91
Buzz Lightyear’s Space Ranger Spin
Average Posted Wait
35
Actual Waits Were
48%
7-Day Rank
#6
30-Day Rank
#26
365-Day Rank
#122
Dumbo the Flying Elephant
Average Posted Wait
8
7-Day Rank
#6
30-Day Rank
#29
365-Day Rank
#187
“it’s a small world”
Average Posted Wait
41
7-Day Rank
#6
30-Day Rank
#24
365-Day Rank
#71
Jungle Cruise
Average Posted Wait
49
Actual Waits Were
90%
7-Day Rank
#3
30-Day Rank
#7
365-Day Rank
#88
Mad Tea Party
Average Posted Wait
12
7-Day Rank
#6
30-Day Rank
#27
365-Day Rank
#156
Mickey’s PhilharMagic
Average Posted Wait
32
7-Day Rank
#3
30-Day Rank
#11
365-Day Rank
#11
Peter Pan’s Flight
Average Posted Wait
41
Actual Waits Were
110%
7-Day Rank
#5
30-Day Rank
#15
365-Day Rank
#104
Pirates of the Caribbean
Average Posted Wait
48
Actual Waits Were
81%
7-Day Rank
#5
30-Day Rank
#21
365-Day Rank
#93
Space Mountain
Average Posted Wait
54
Actual Waits Were
73%
7-Day Rank
#4
30-Day Rank
#10
365-Day Rank
#96
Splash Mountain
Average Posted Wait
63
Actual Waits Were
60%
7-Day Rank
#4
30-Day Rank
#8
365-Day Rank
#49
The Barnstormer
Average Posted Wait
20
7-Day Rank
#6
30-Day Rank
#26
365-Day Rank
#132
The Haunted Mansion
Average Posted Wait
18
Actual Waits Were
41%
7-Day Rank
#6
30-Day Rank
#27
365-Day Rank
#206
The Magic Carpets of Aladdin
Average Posted Wait
12
7-Day Rank
#5
30-Day Rank
#26
365-Day Rank
#158
The Many Adventures of Winnie the Pooh
Average Posted Wait
25
Actual Waits Were
100%
7-Day Rank
#6
30-Day Rank
#24
365-Day Rank
#133
Tomorrowland Speedway
Average Posted Wait
12
7-Day Rank
#5
30-Day Rank
#27
365-Day Rank
#186
Walt Disney’s Carousel of Progress
Average Posted Wait
15
7-Day Rank
#1
30-Day Rank
#1
365-Day Rank
#1
Seven Dwarfs Mine Train
Average Posted Wait
82
7-Day Rank
#3
30-Day Rank
#7
365-Day Rank
#87
Under the Sea ~ Journey of the Little Mermaid
Average Posted Wait
12
7-Day Rank
#6
30-Day Rank
#29
365-Day Rank
#192

Animal Kingdom Wait Times

Posted wait times at Expedition Everest were about three times higher than actual waits, which is really unusual and tells you that today’s posted wait times aren’t to be believed. Expedition Everest had an average wait time today of 41 minutes. We received 17 actual wait times today, and the actual wait averaged 30% of the posted wait time.

Animal Kingdom wait times for Thursday, December 31, 2020
DINOSAUR
Average Posted Wait
61
7-Day Rank
#4
30-Day Rank
#9
365-Day Rank
#31
Expedition Everest – Legend of the Forbidden Mountain
Average Posted Wait
41
Actual Waits Were
30%
7-Day Rank
#3
30-Day Rank
#7
365-Day Rank
#95
Kali River Rapids
Average Posted Wait
50
7-Day Rank
#1
30-Day Rank
#1
365-Day Rank
#2
Kilimanjaro Safaris
Average Posted Wait
33
Actual Waits Were
60%
7-Day Rank
#4
30-Day Rank
#11
365-Day Rank
#93
It’s Tough to Be a Bug!
Average Posted Wait
38
7-Day Rank
#1
30-Day Rank
#1
365-Day Rank
#1
TriceraTop Spin
Average Posted Wait
9
7-Day Rank
#3
30-Day Rank
#10
365-Day Rank
#70
Na’vi River Journey
Average Posted Wait
87
7-Day Rank
#1
30-Day Rank
#1
365-Day Rank
#34
Avatar Flight of Passage
Average Posted Wait
84
Actual Waits Were
69%
7-Day Rank
#3
30-Day Rank
#7
365-Day Rank
#94

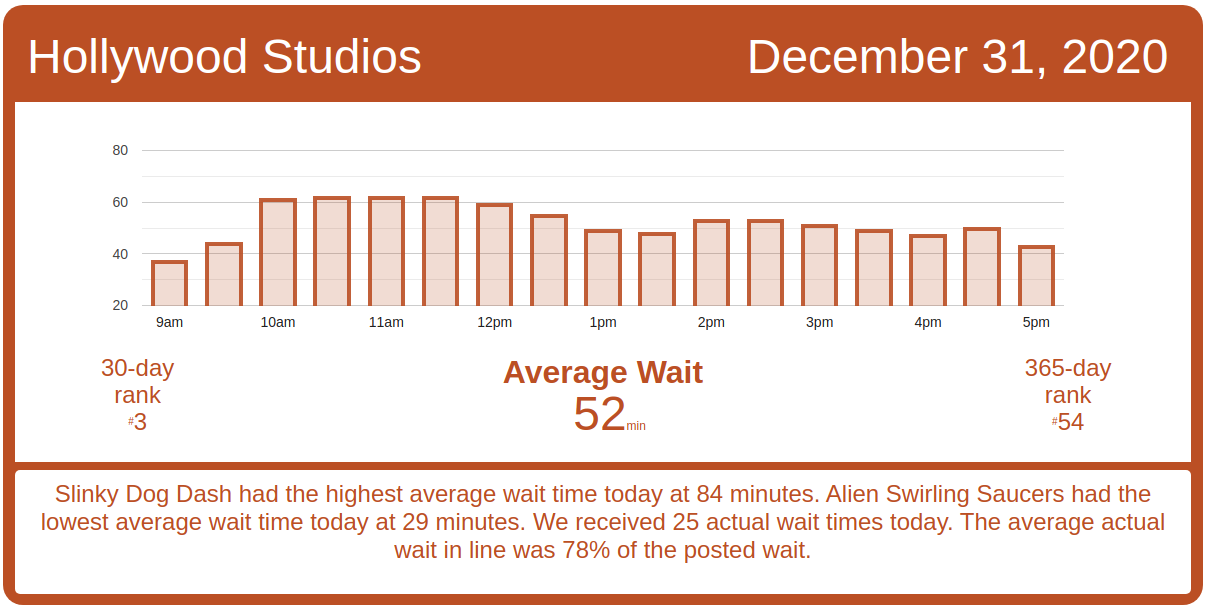
Hollywood Studios Wait Times

Millennium Falcon: Smugglers Run had an average wait time today of 78 minutes. Its 7-day average is 67 minutes, so today ranks #1 for this week. Its 30-day average is 64 minutes, so today ranks #3 for the past month. Its 365-day average is 60 minutes, so today ranks #37 for the past year. We received 4 actual wait times today, and the actual wait averaged 84% of the posted wait time.

Hollywood Studios wait times for Thursday, December 31, 2020

Rise of the Resistance has had a couple of long ride outages today, delaying the calling of boarding groups to experience the ride.

Rise of the Resistance boarding groups for Thursday, December 31, 2020
Muppet*Vision 3D
Average Posted Wait
38
7-Day Rank
#1
30-Day Rank
#1
365-Day Rank
#1
Rock ‘n’ Roller Coaster Starring Aerosmith
Average Posted Wait
69
7-Day Rank
#1
30-Day Rank
#1
365-Day Rank
#60
Star Tours: The Adventures Continue
Average Posted Wait
45
7-Day Rank
#1
30-Day Rank
#1
365-Day Rank
#14
The Twilight Zone Tower of Terror
Average Posted Wait
78
7-Day Rank
#1
30-Day Rank
#3
365-Day Rank
#49
Toy Story Mania!
Average Posted Wait
32
Actual Waits Were
61%
7-Day Rank
#6
30-Day Rank
#11
365-Day Rank
#100
Slinky Dog Dash
Average Posted Wait
84
7-Day Rank
#1
30-Day Rank
#1
365-Day Rank
#56
Alien Swirling Saucers
Average Posted Wait
29
7-Day Rank
#6
30-Day Rank
#16
365-Day Rank
#100
Mickey & Minnie’s Runaway Railway
Average Posted Wait
43
Actual Waits Were
79%
7-Day Rank
#3
30-Day Rank
#22
365-Day Rank
#166
Millennium Falcon: Smugglers Run
Average Posted Wait
78
Actual Waits Were
84%
7-Day Rank
#1
30-Day Rank
#3
365-Day Rank
#37

EPCOT Wait Times

Soarin’ had an average wait time today of 81 minutes. Its 7-day average is 60 minutes, so today ranks #2 for this week. Its 30-day average is 47 minutes, so today ranks #2 for the past month. Its 365-day average is 37 minutes, so today ranks #6 for the past year. We received 6 actual wait times today, and the actual wait averaged 50% of the posted wait time.

EPCOT wait times for Thursday, December 31, 2020
Gran Fiesta Tour Starring The Three Caballeros
Average Posted Wait
20
7-Day Rank
#1
30-Day Rank
#1
365-Day Rank
#6
Journey Into Imagination With Figment
Average Posted Wait
33
Actual Waits Were
15%
7-Day Rank
#2
30-Day Rank
#2
365-Day Rank
#10
Living with the Land
Average Posted Wait
14
7-Day Rank
#1
30-Day Rank
#8
365-Day Rank
#89
Mission: SPACE Orange
Average Posted Wait
69
7-Day Rank
#3
30-Day Rank
#3
365-Day Rank
#8
Reflections of China
Average Posted Wait
15
7-Day Rank
#1
30-Day Rank
#1
365-Day Rank
#1
Soarin’
Average Posted Wait
81
Actual Waits Were
50%
7-Day Rank
#2
30-Day Rank
#2
365-Day Rank
#6
Spaceship Earth
Average Posted Wait
38
7-Day Rank
#3
30-Day Rank
#3
365-Day Rank
#14
Test Track
Average Posted Wait
100
7-Day Rank
#2
30-Day Rank
#2
365-Day Rank
#4
The Seas with Nemo & Friends
Average Posted Wait
23
7-Day Rank
#2
30-Day Rank
#2
365-Day Rank
#34
Frozen Ever After
Average Posted Wait
66
Actual Waits Were
47%
7-Day Rank
#1
30-Day Rank
#16
365-Day Rank
#83

The post Saying Goodbye to 2020 — Disney World Wait Times for December 31, 2020 appeared first on TouringPlans.com Blog.