
Crowds were among the largest of the week at the Magic Kingdom and EPCOT today, while the Studios and Animal Kingdom were slower compared to other days in the past month. As part of our ongoing research, we counted 500 guests at Disney’s Animal Kingdom today, and 482 of them (96%) were following Disney’s mask guidelines. Let’s do the numbers.
Magic Kingdom Wait Times
Big Thunder Mountain Railroad had an average wait time today of 36 minutes. Its 7-day average is 37 minutes, so today ranks #4 for this week. Its 30-day average is 44 minutes, so today ranks #24 for the past month. And Seven Dwarfs Mine Train had an average wait time today of 54 minutes. Its 7-day average is 48 minutes, so today ranks #2 for this week. Its 30-day average is 60 minutes, so today ranks #22 for the past month.
Two Magic Kingdom attractions had their highest average posted wait times of the week on Sunday:
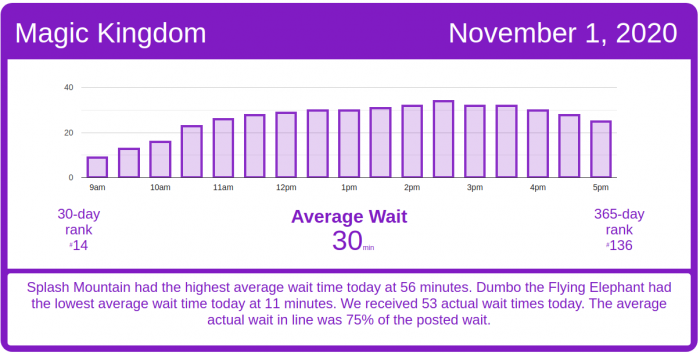
- Splash Mountain had an average wait time today of 56 minutes. Its 7-day average is 44 minutes, so today ranks #1 for this week. Its 30-day average is 61 minutes, so today ranks #17 for the past month. We received 7 actual wait times at Splash today, and the actual wait averaged 73% of the posted wait time.
- Space Mountain had an average wait time today of 42 minutes. Its 7-day average is 27 minutes, so today ranks #1 for this week. Its 30-day average is 42 minutes, so today ranks #16 for the past month.

Secondary attractions had average wait times for the week:
- Buzz Lightyear’s Space Ranger Spin had an average wait time today of 29 minutes. Its 7-day average is 23 minutes, so today ranks #2 for this week. Its 30-day average is 31 minutes, so today ranks #18 for the past month. We received 5 actual wait times today at Buzz, and the actual wait averaged 80% of the posted wait time.
- Jungle Cruise had an average wait time today of 39 minutes. Its 7-day average is 34 minutes, so today ranks #2 for this week. Its 30-day average is 41 minutes, so today ranks #22 for the past month.
- Pirates of the Caribbean had an average wait time today of 40 minutes. Its 7-day average is 37 minutes, so today ranks #2 for this week. Its 30-day average is 47 minutes, so today ranks #24 for the past month. We received 7 actual wait times today, and the actual wait averaged 79% of the posted wait time.
- The Haunted Mansion had an average wait time today of 38 minutes. Its 7-day average is 38 minutes, so today ranks #3 for this week. Its 30-day average is 44 minutes, so today ranks #23 for the past month. We received 4 actual wait times today, and the actual wait averaged 86% of the posted wait time. So that means the average actual wait time today was about 32 minutes.
If you’ve got to visit during a busy weekend, have a special tool at your side. Subscribe today and get our Lines app too.

Animal Kingdom Wait Times
Let’s start in Pandora. Avatar Flight of Passage had an average wait time today of 67 minutes. Its 7-day average is 39 minutes, so today ranks #1 for this week. Its 30-day average is 63 minutes, so today ranks #13 for the past month. We received 5 actual wait times today, and the actual wait averaged 81% of the posted wait time. And Na’vi River Journey had an average wait time today of 45 minutes. Its 7-day average is 39 minutes, so today ranks #1 for this week. Its 30-day average is 46 minutes, so today ranks #14 for the past month. We received 7 actual wait times today at Na’vi, and the actual wait averaged 92% of the posted wait time.
Posted wait times at Kilimanjaro Safaris continue to be about twice your actual wait. Kilimanjaro Safaris had an average wait time today of 24 minutes. Its 7-day average is 16 minutes, so today ranks #1 for this week. Its 30-day average is 22 minutes, so today ranks #9 for the past month. We received 9 actual wait times today, and the actual wait averaged 48% of the posted wait time. So with the average posted wait time today being 24 minutes, the average actual time spent in line was around 12 minutes.
Expedition Everest – Legend of the Forbidden Mountain had an average wait time today of 40 minutes. Its 7-day average is 22 minutes, so today ranks #1 for this week. Its 30-day average is 32 minutes, so today ranks #7 for the past month. We received 9 actual wait times today, and the actual wait averaged 65% of the posted wait time.
Kali River Rapids had an average wait time today of 35 minutes. Its 7-day average is 15 minutes, so today ranks #1 for this week. Its 30-day average is 24 minutes, so today ranks #4 for the past month.

Hollywood Studios Wait Times
Like Kilimanjaro Safaris over at Animal Kingdom, posted wait times at Toy Story Mania! seem to be consistently inflated as well. TSM had an average wait time today of 24 minutes. Its 7-day average is 25 minutes, so today ranks #3 for this week. Its 30-day average is 30 minutes, so today ranks #26 for the past month. We received 6 actual wait times today, and the actual wait averaged 34% of the posted wait time, which means the average actual wait time today was under 10 minutes.
Rock ‘n’ Roller Coaster Starring Aerosmith had an average wait time today of 43 minutes. Its 7-day average is 45 minutes, so today ranks #4 for this week. Its 30-day average is 52 minutes, so today ranks #27 for the past month. We received 5 actual wait times today, and the actual wait averaged 80% of the posted wait time.
The Twilight Zone Tower of Terror had an average wait time today of 40 minutes. Its 7-day average is 42 minutes, so today ranks #3 for this week. Its 30-day average is 48 minutes, so today ranks #26 for the past month. Its 365-day average is 61 minutes, so today ranks #189 for the past year. We received 9 actual wait times at Tower today, and the actual wait averaged 74% of the posted wait time.
Mickey & Minnie’s Runaway Railway had an average wait time today of 64 minutes. Its 7-day average is 70 minutes, so today ranks #5 for this week. Its 30-day average is 81 minutes, so today ranks #28 for the past month.

Millennium Falcon: Smugglers Run had an average wait time today of 49 minutes. Its 7-day average is 50 minutes, so today ranks #3 for this week. Its 30-day average is 59 minutes, so today ranks #26 for the past month.
Rise of the Resistance ran well today until just before 2 p.m., when boarding groups were paused for almost an hour. Once things resumed, however, Rise ran well again. That’s great to see.

EPCOT Wait Times
Frozen Ever After had an average wait time today of 70 minutes. Its 7-day average is 53 minutes, so today ranks #1 for this week. Its 30-day average is 64 minutes, so today ranks #7 for the past month. And Gran Fiesta Tour Starring The Three Caballeros had an average wait time today of 14 minutes. Its 7-day average is 7 minutes, so today ranks #1 for this week. Its 30-day average is 10 minutes, so today ranks #4 for the past month.
Soarin’ had an average wait time today of 45 minutes. Its 7-day average is 25 minutes, so today ranks #1 for this week. Its 30-day average is 37 minutes, so today ranks #8 for the past month. We received 7 actual wait times today, and the actual wait averaged 81% of the posted wait time.
Living with the Land had an average wait time today of 14 minutes. Its 7-day average is 11 minutes, so today ranks #1 for this week. Its 30-day average is 13 minutes, so today ranks #11 for the past month. We received 5 actual wait times today, and the actual wait averaged 34% of the posted wait time.
Spaceship Earth had an average wait time today of 23 minutes. Its 7-day average is 14 minutes, so today ranks #1 for this week. Its 30-day average is 19 minutes, so today ranks #9 for the past month. We received 6 actual wait times today, and the actual wait averaged 58% of the posted wait time.
Test Track had an average wait time today of 61 minutes. Its 7-day average is 49 minutes, so today ranks #1 for this week. Its 30-day average is 64 minutes, so today ranks #17 for the past month. Its 365-day average is 58 minutes, so today ranks #86 for the past year.
The Seas with Nemo & Friends had an average wait time today of 13 minutes. Its 7-day average is 9 minutes, so today ranks #1 for this week. Its 30-day average is 13 minutes, so today ranks #12 for the past month. Its 365-day average is 17 minutes, so today ranks #156 for the past year.
The post A Busy, But Not Overwhelming Day at Walt Disney World – Wait Times for Sunday, November 1, 2020 appeared first on TouringPlans.com Blog.