
Animal Kingdom and Magic Kingdom are showing strong post-reopening wait times again today. Splash Mountain and Kali River Rapids in particular, had one of their busiest days of the past year. Let’s do the numbers.
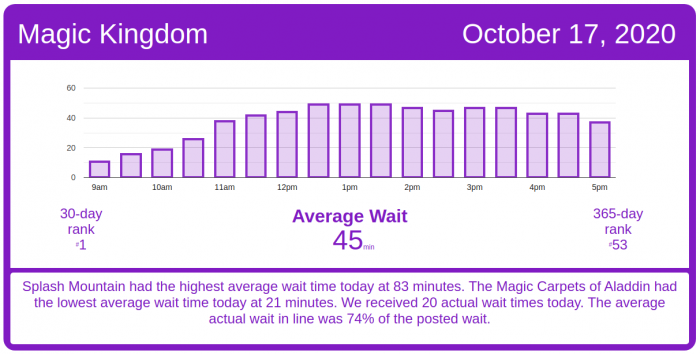
Magic Kingdom Wait Times
Most Magic Kingdom attractions today have posted their highest average wait times of the past month:
- Seven Dwarfs Mine Train had an average wait time today of 81 minutes. Its 7-day average is 66 minutes, so today ranks #1 for this week. Its 30-day average is 57 minutes, so today ranks #1 for the past month. It was only the 124th-highest average wait of the past year, though.
- Space Mountain had an average wait time today of 64 minutes (#1 week / #1 month). Its 7-day average is 50 minutes, and its 30-day average is 41 minutes (#106 for the past year).
- Splash Mountain had an average wait time today of 83 minutes. Its 7-day average is 73 minutes, so today ranks #1 for this week. Its 30-day average is 62 minutes, so today ranks #1 for the past month. Its 365-day average is 52 minutes, so today ranks #25 for the past year.
- Big Thunder Mountain Railroad had an average wait time today of 54 minutes (#1 week / #4 month / #99 year).
Even secondary attractions were busy today:
- Walt Disney’s Carousel of Progress had its highest average wait time today of the past year: 30 minutes.
- Peter Pan’s Flight had an average wait time today of 49 minutes (#1 week / #1 year / #142 year).
- The Haunted Mansion had an average wait time today of 62 minutes (#1 week / #1 month / #50 year). Its 7-day average is 48 minutes, so today ranks #1 for this week. Its 30-day average is 44 minutes, so today ranks #1 for the past month.
 EPCOT Wait Times

EPCOT was also busy, with many attractions posting wait times that would be relatively strong over the past year:
- Soarin’ had an average wait time today of 56 minutes. Its 7-day average is 46 minutes, so today ranks #1 for this week. Its 30-day average is 34 minutes, so today ranks #2 for the past month. Its 365-day average is 40 minutes, so today ranks #46 for the past year.
- Test Track had an average wait time today of 91 minutes. Its 7-day average is 68 minutes, so today ranks #1 for this week. Its 30-day average is 58 minutes, so today ranks #1 for the past month. Its 365-day average is 58 minutes, so today ranks #18 for the past year.
- Spaceship Earth had an average wait time today of 32 minutes. Its 7-day average is 22 minutes, so today ranks #1 for this week. Its 30-day average is 18 minutes, so today ranks #3 for the past month. Its 365-day average is 22 minutes, so today ranks #44 for the past year.
- Frozen Ever After had an average wait time today of 80 minutes. Its 7-day average is 71 minutes, so today ranks #1 for this week. Its 30-day average is 59 minutes, so today ranks #2 for the past month. Its 365-day average is 58 minutes, so today ranks #29 for the past year.
That said, the actual wait times we got today averaged less than half of the posted wait times shown, so a posted wait of 20 minutes at Living with the Land resulted in an actual wait of 10 minutes.

Hollywood Studios Wait Times
Wait times were mixed over at Hollywood Studios today. Rock ‘n’ Roller Coaster had an average wait today of 60 minutes. Its 7-day average is 57 minutes, so today ranks #1 for this week. Its 30-day average is 51 minutes, so today ranks #2 for the past month. Actual wait times averaged around 86% of the posted wait, which is really accurate (relatively speaking) for this ride.
Mickey & Minnie’s Runaway Railway had an average wait time today of 83 minutes (#3 week / #14 month). The actual wait in line averaged 74% of the posted wait time, also pretty accurate.
Slinky Dog Dash had an average wait time today of 71 minutes. Its 7-day average is 72 minutes, so today ranks #4 for this week. Its 30-day average is 66 minutes, so today ranks #10 for the past month. Its 365-day average is 76 minutes, so today ranks #142 for the past year.
Millennium Falcon: Smugglers Run had an average wait time today of 65 minutes (#1 week / #7 month). Its 365-day average is 64 minutes – today ranks #100 for the past year.

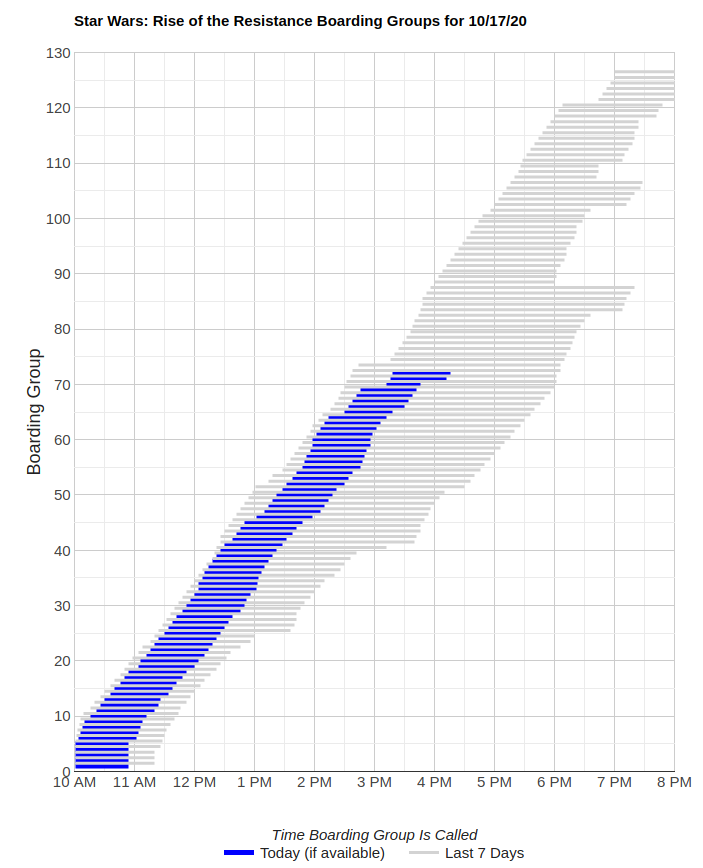
It looks like Rise of the Resistance started having technical issues in the afternoon today, because 72 was the last boarding group called, at around 4:15 p.m.
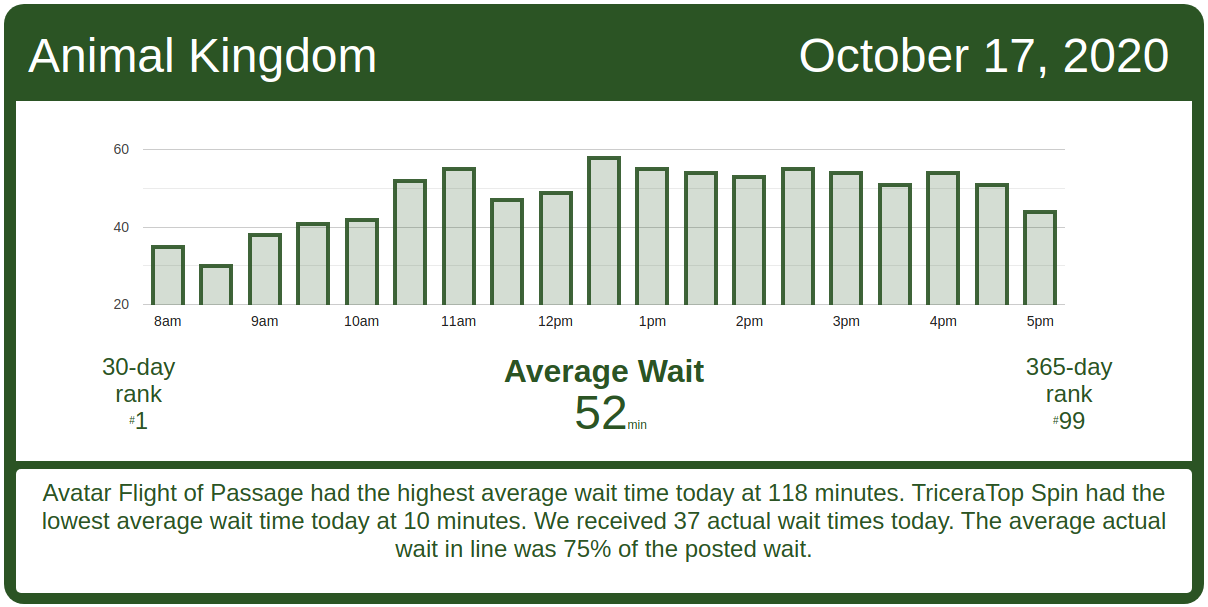
Animal Kingdom Wait Times
Posted wait times were also relatively accurate over at Animal Kingdom today, averaging 75% of the posted wait time. Avatar Flight of Passage had an average wait time today of 118 minutes. Its 7-day average is 74 minutes, so today ranks #1 for this week. Its 30-day average is 53 minutes, so today ranks #1 for the past month. Its 365-day average is 104 minutes, so today ranks #124 for the past year. We received 6 actual wait times today, and the actual wait averaged 86% of the posted wait time.
Kilimanjaro Safaris had an average wait time today of 32 minutes. Its 7-day average is 24 minutes, so today ranks #1 for this week. Its 30-day average is 21 minutes, so today ranks #1 for the past month. Its 365-day average is 52 minutes, so today ranks #146 for the past year. We received 15 actual wait times today, and the actual wait averaged 63% of the posted wait time.
Kali River Rapids had an average wait time today of 46 minutes. Its 7-day average is 31 minutes, so today ranks #1 for this week. Its 30-day average is 23 minutes, so today ranks #1 for the past month. Its 365-day average is 24 minutes, so today ranks #21 for the past year.
Wait times are only part of the story. If you’d like to be ahead of the curve and get customized, computer-optimized touring plans for your specific vacation, then become a TouringPlans Subscriber and use our Lines app.

The post Busy Saturday at Animal Kingdom, Magic Kingdom – Walt Disney World Wait Times for Saturday, October 17, 2020 appeared first on TouringPlans.com Blog.